Showcase Profit Growth with Icons and Arrows
Product Description
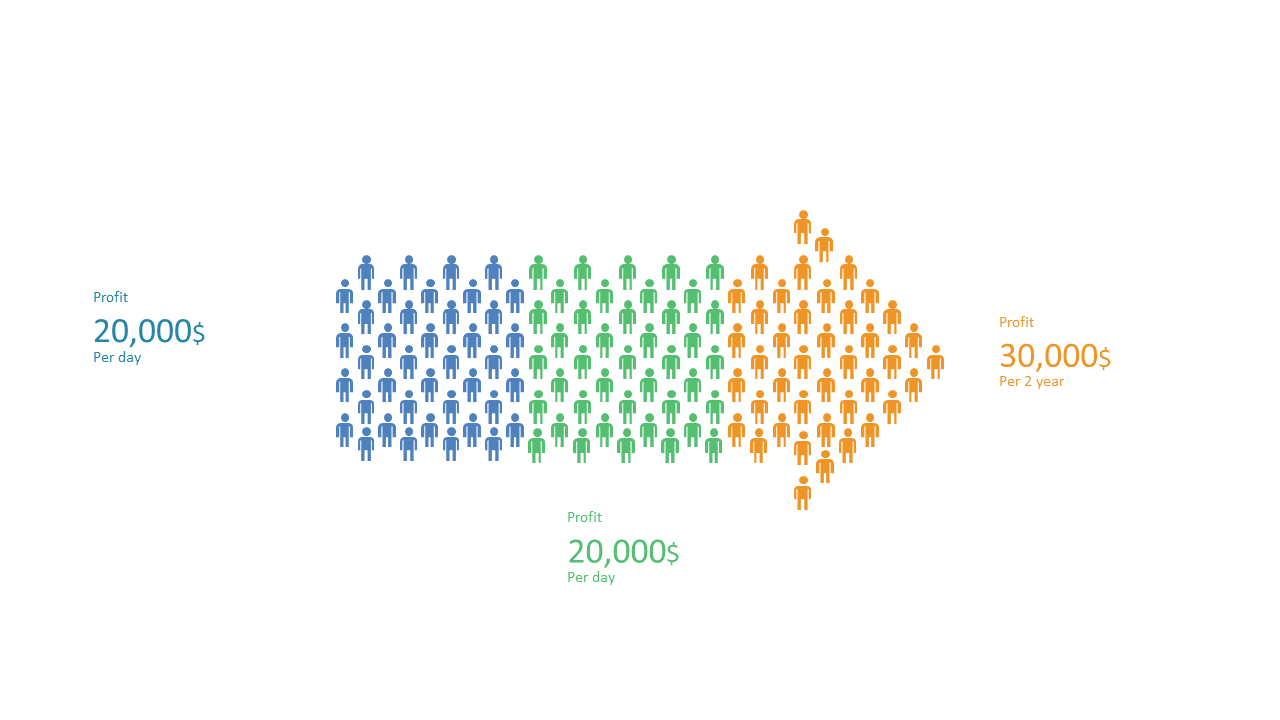
In a data-driven environment, presenting information in a way that’s both accurate and captivating is crucial. You want to ensure your audience not only understands the data but also engages with it. This slide presents profit growth through visually striking icons and arrows, making the information accessible and dynamic.
Data analysts, marketing professionals, and business developers working in growth-focused industries can utilize this slide for performance reviews, team meetings, or client updates. By showcasing profit trends clearly, you’ll not only inform but also inspire your audience to take action.
For only $0.99, this slide is an instant download and is easily editable in PowerPoint and Google Slides.
You can customize it quickly, ensuring you have a professional-looking visual ready for your next presentation in just minutes.
$0.99 – Purchase Checkout
Added to cart







