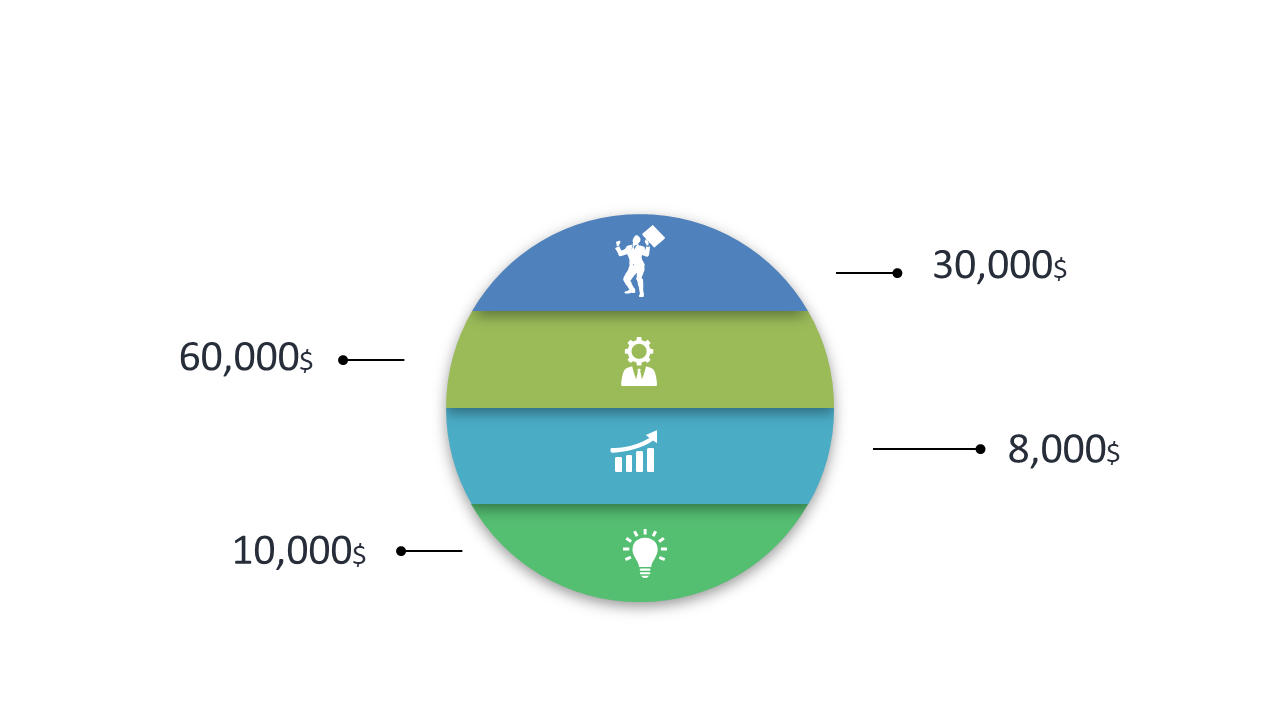
Visualize Financial Data with Segmented Doughnut Chart
Product Description
Presenting financial data clearly can sometimes feel like a daunting task, especially when your audience needs to glean insights quickly. With a segmented doughnut chart, you can effectively visualize data categories without overwhelming your listeners with raw numbers.
This slide streamlines that process, helping your audience understand the insights you want to convey. Finance professionals, analysts, and business strategists in sectors like accounting, fintech, or corporate planning will find this slide particularly useful for financial presentations, board meetings, or performance analyses. The distinct color bands make it easy to differentiate between categories, enhancing comprehension.
At a price of just $0.99, this slide is available for immediate download and can be customized in both PowerPoint and Google Slides. Get your data visualized effectively in minutes, making your next presentation impactful and clear.
$0.99 – Purchase Checkout
Added to cart







