Compare Metrics with Dual Circular Progress Charts
Product Description
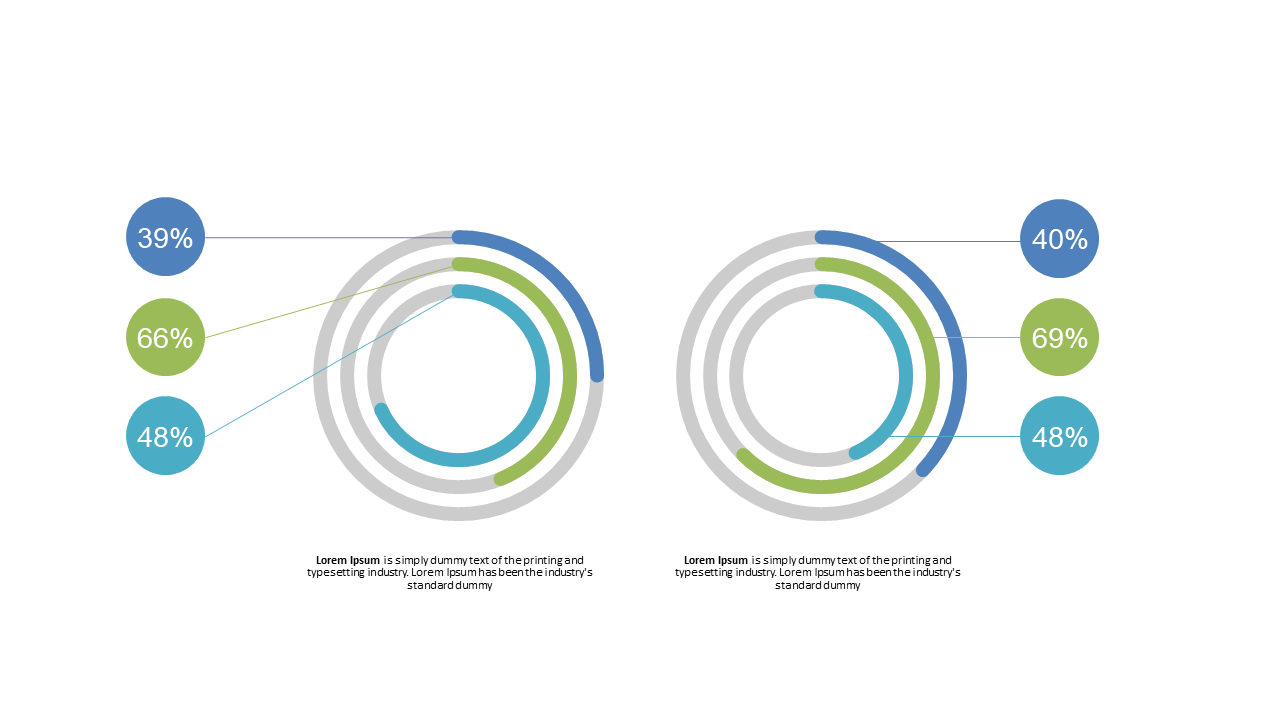
Translating complex data into actionable insights can feel overwhelming, especially when you’re strapped for time to make your point clear. This dual circular progress chart slide provides you with a straightforward visual that simplifies comparisons of key metrics, allowing your audience to grasp important figures instantly.
Data analysts and business intelligence professionals will find this slide particularly useful during quarterly reviews or performance briefings. By presenting your findings with these interconnected charts, you can highlight trends and discrepancies in a way that’s easy for your audience to digest.
At just $0.99, this slide is an instant download that’s fully editable in both PowerPoint and Google Slides. You’ll be able to tailor it to fit your presentation in mere minutes, helping you communicate your insights effectively.
$0.99 – Purchase Checkout
Added to cart







