Visualize Global Business Metrics Clearly
Product Description
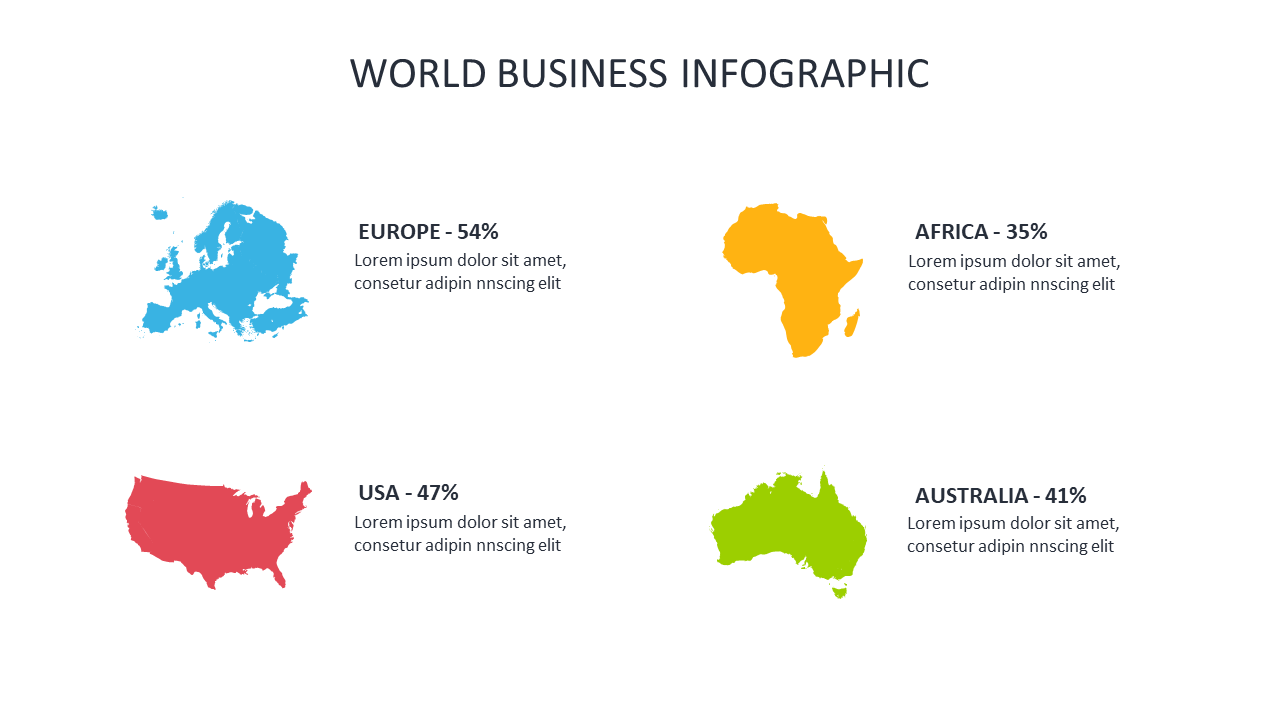
When it comes to presenting global business metrics, clarity can often be lost in translation. This slide is tailored to transform overwhelming data into a straightforward visual format, showcasing geographical regions alongside their key metrics in a clean layout.
Financial analysts, business strategists, and executives preparing for board meetings will find this slide perfect for presenting annual reports or strategy proposals. It allows you to translate data-heavy discussions into visually appealing narratives that resonate with your audience.
Available for just $0.99, this slide is ready for instant download and easy to edit in PowerPoint or Google Slides. Get the clarity you need for your presentations without delay, and make your data shine.
$0.99 – Purchase Checkout
Added to cart







