Showcase Texas Demographics with Gender Insights
Product Description
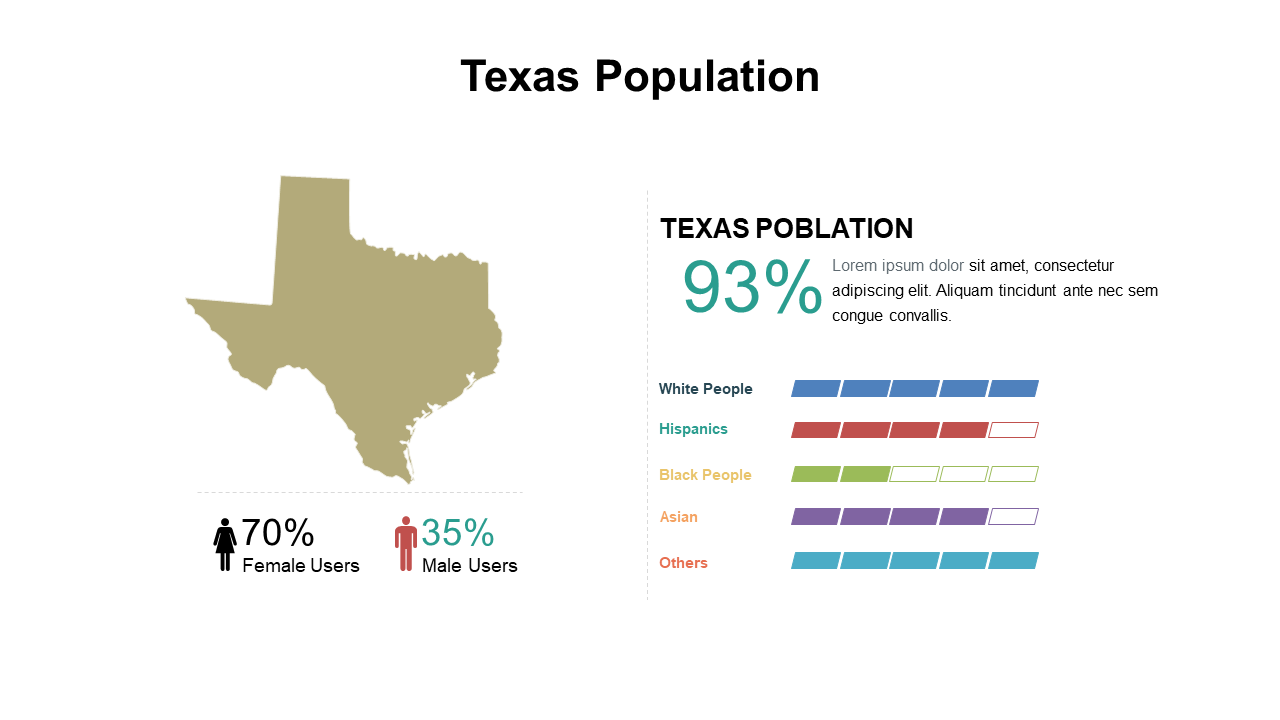
Making demographic data easy to understand is often a challenge. This slide provides a clear visual representation of Texas demographics with a user-friendly layout, so you can convey essential gender insights without causing confusion.
This resource is perfect for researchers, HR professionals, and educators who need to share demographic findings in workshops, presentations, or community meetings. With its straightforward design, you can engage your audience effectively and ensure they grasp key takeaways effortlessly.
For just $0.99, you can download this slide immediately and customize it in PowerPoint or Google Slides. Elevate your presentations with clarity and precision in just a few clicks.
$0.99 – Purchase Checkout
Added to cart







