Present Key Metrics with Data Table Layout
Product Description
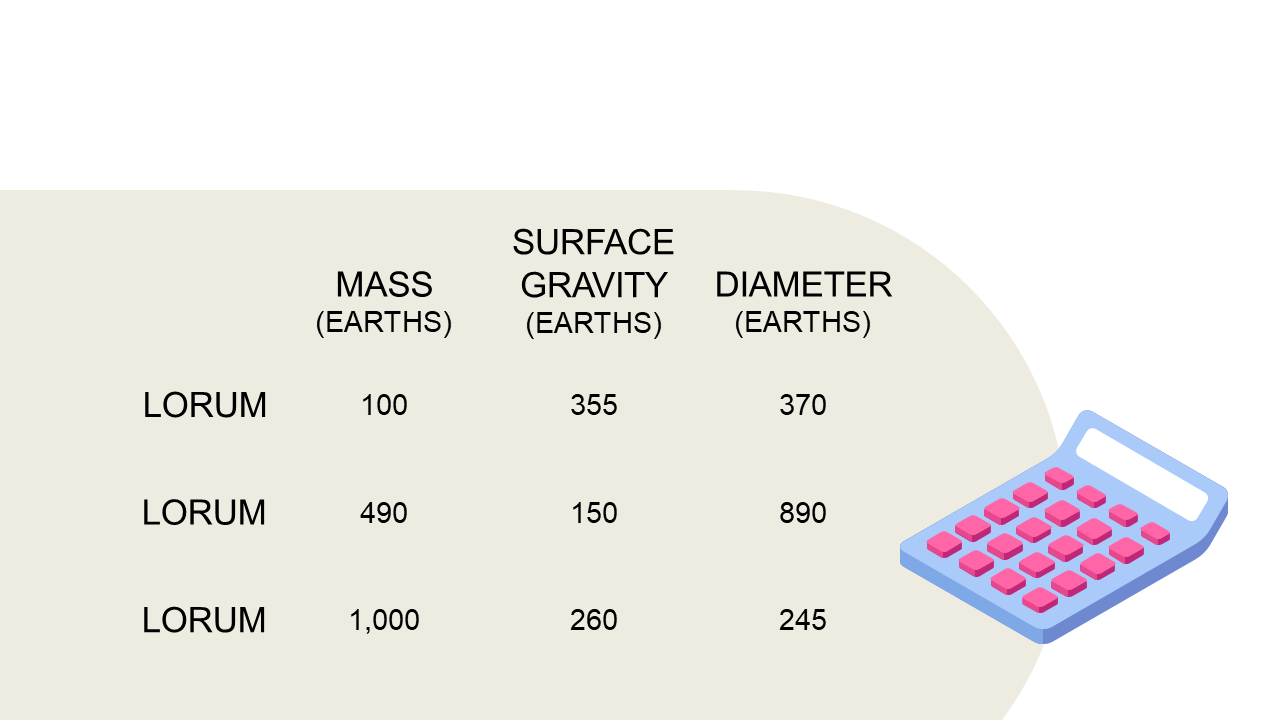
Finding the right way to present key metrics can feel overwhelming, especially when the details are complex or numerous. This slide serves up a straightforward data table layout that makes it easy to display critical information like mass, surface gravity, and diameter in a way that’s clear and visually appealing. With a handy calculator icon, it helps you convey your message without clutter.
Data analysts and project managers will find this slide invaluable during quarterly reviews or project performance updates. If you’re presenting scientific data or financial metrics, this layout allows you to captivate your audience by making the numbers digestible.
It’s perfect for professionals in tech, finance, or research sectors looking for clarity in their presentations. At just $0.99, this slide is ready for instant download and can be easily edited in both PowerPoint and Google Slides. You’ll have a polished and professional presentation in minutes, making it a time-saving addition to your toolkit.
$0.99 – Purchase Checkout
Added to cart







