Explore Western Asia with Key Highlights

Product Description
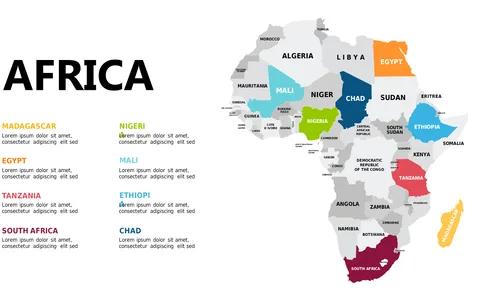
Presenting complex data about Western Asia can feel overwhelming, especially if your audience struggles to visualize the information. This slide simplifies that challenge with a detailed map that uses color coding to identify specific countries, ensuring your audience can easily grasp the regional highlights.
Geopolitical analysts, project managers involved in regional initiatives, and educators teaching about global affairs will find this slide essential for creating engaging presentations. Whether you’re discussing economic trends or geopolitical issues, this visual tool makes your data more accessible.
For just $0.99, you can download this slide instantly and edit it in both PowerPoint and Google Slides. Make your next presentation stand out with visuals that clarify complex regional data.
$0.99 – Purchase Checkout
Added to cart