Visualize Europe with Color-Coded Map and Annotations
Product Description
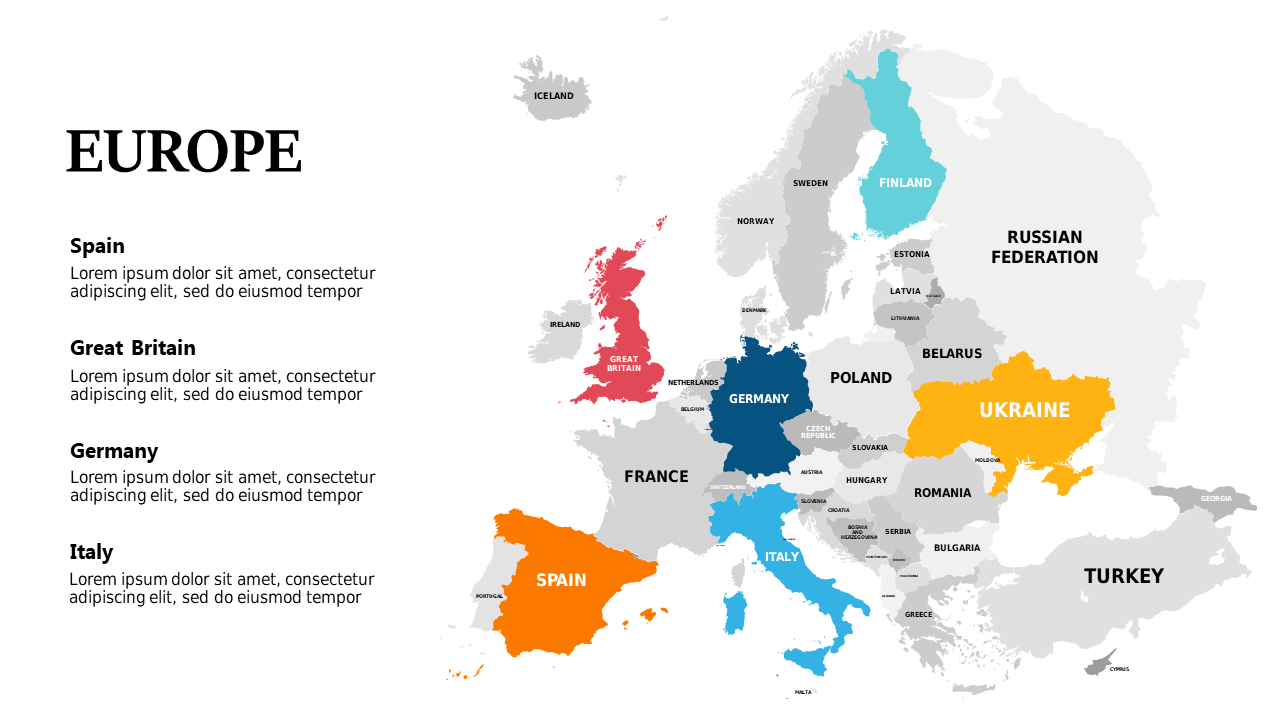
Finding it tough to present geographic data in a concise and visually appealing format? This annotated, color-coded map of Europe allows you to break down complex information and highlight key insights efficiently.
By using this slide, you can ensure your audience grasps the critical geographical distinctions that drive your business decisions. Ideal for consultants conducting market research, sales representatives explaining territory alignments, or educators teaching geography, this visual tool helps make data more relatable. You can leverage it in town hall meetings, strategy sessions, or even classroom presentations, giving your audience clarity on regional performance.
At just $0.99, you can easily download this slide and make instant edits in PowerPoint or Google Slides. With a quick customization process, you’ll find that conveying geographic data has never been easier.
$0.99 – Purchase Checkout
Added to cart