Explore Africa with Color-Coded Map Highlights
Product Description
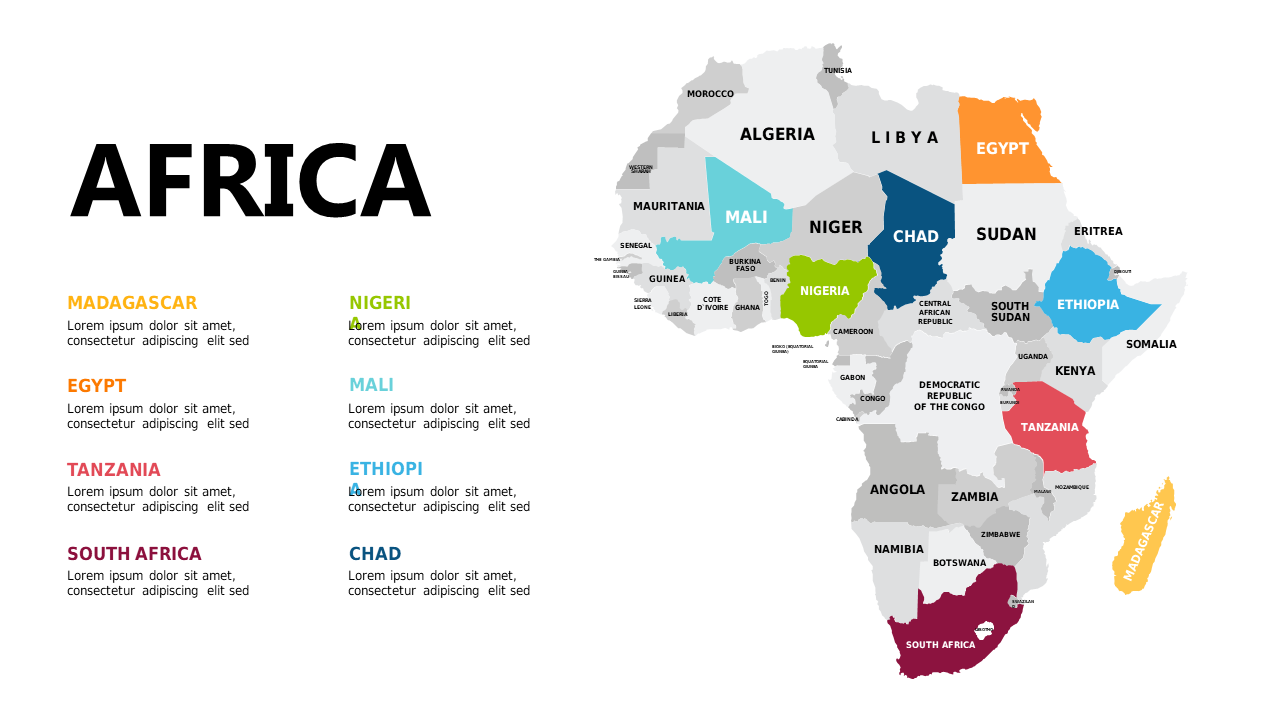
Tired of using generic maps that don’t effectively communicate your geographic insights? This color-coded map of Africa shines a light on regional distinctions while allowing you to tailor the colors and annotations for your specific needs.
It helps you tell a compelling story with data, whether you’re presenting analysis or educational content. This slide is particularly useful for researchers in the field of international development, educators teaching African geography, or business analysts focused on emerging markets. You can present during conferences, classroom settings, or remote meetings, ensuring that your audience connects with the information presented.
Available for $0.99, this slide offers instant download with the ability to customize in both PowerPoint and Google Slides. Editing the map to suit your presentation style is a breeze, so you can focus on sharing insights rather than formatting slides.
$0.99 – Purchase Checkout
Added to cart







