Highlight North America with Customizable Map Layout
Product Description
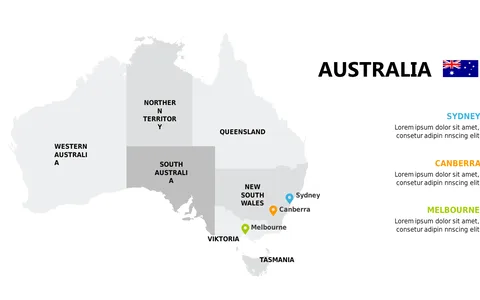
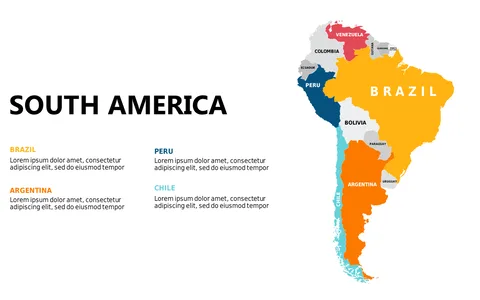
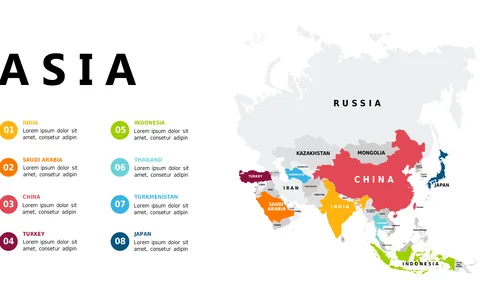
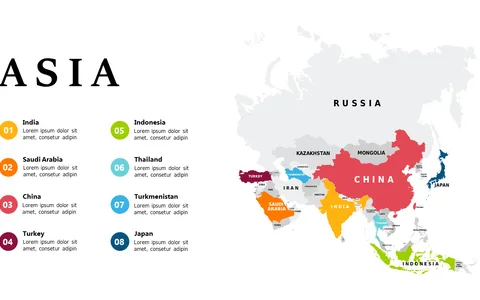
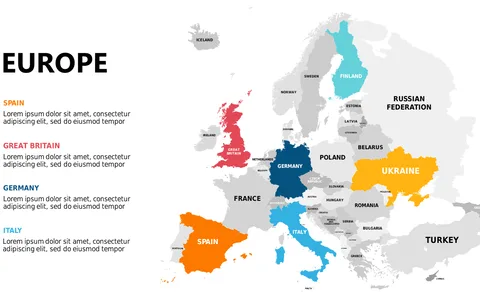
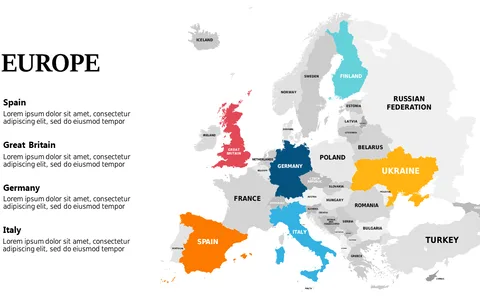
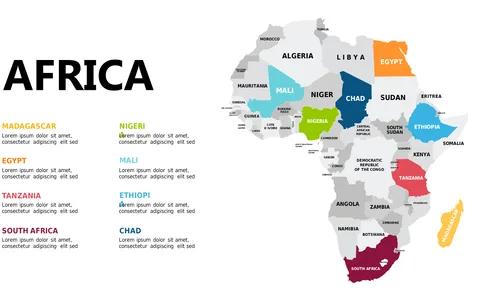
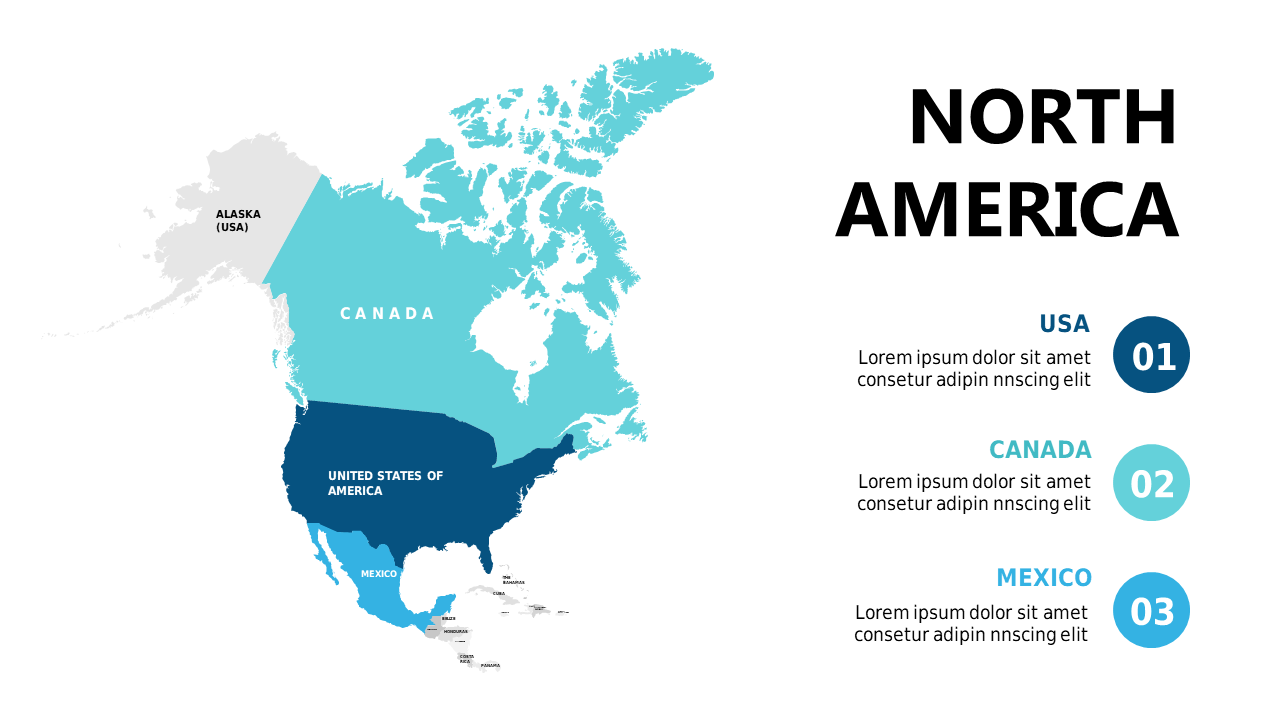
Visualizing complex sales territories can be a daunting task, especially when numbers and data are involved. This map layout allows you to pinpoint specific regions in North America, making it easier for your audience to grasp where your focus should lie and what areas need attention. By using this customizable map, you can ensure that the most relevant information stands out.
This slide is perfect for sales managers outlining their strategies, regional directors identifying target markets, or even business analysts presenting geographic data during quarterly reviews. Whether you’re in retail, real estate, or any sector that relies on geographical insights, this template will help clarify your message and engage your audience more effectively.
For just $0.99, you can download this slide and
easily customize it in both PowerPoint and Google Slides. It’s designed for quick edits, so you can have it ready in minutes, making it a hassle-free addition to your presentation arsenal.
$0.99 – Purchase Checkout
Added to cart