Compare Watch Features with Thumbnails
Product Description
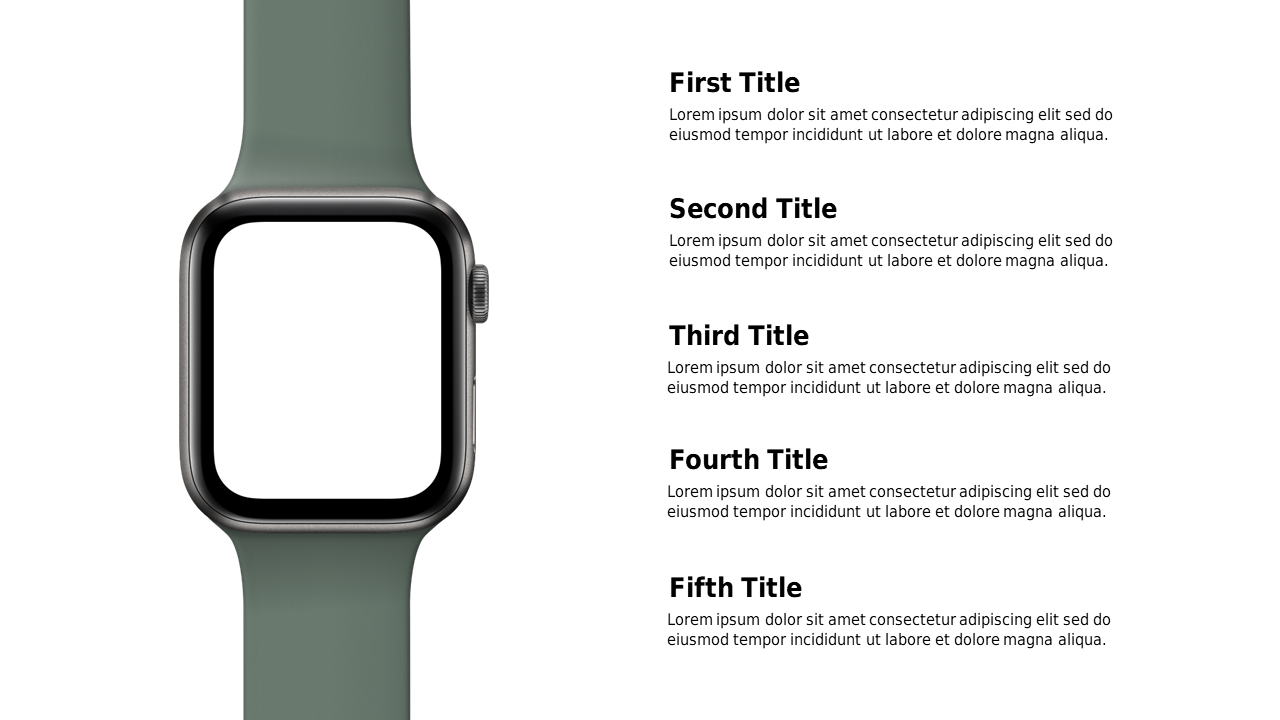
When it comes to comparing product features, having a well-organized format is crucial for clarity. This slide layout presents a structured list alongside thumbnail images, simplifying the process of showcasing various items in a side-by-side comparison.
This slide is especially useful for product managers, sales teams, or marketers who need to present product options or specifications clearly. Whether you’re demonstrating the differences in smartwatch models in a sales pitch or comparing features during a product review, this slide is designed to enhance your communication.
Available for $0.99, you can easily download and implement this slide in minutes. It’s fully editable in both PowerPoint and Google Slides, so you can make it uniquely yours and ready for any audience.
$0.99 – Purchase Checkout
Added to cart







