Visualize Value Propositions with Venn Diagram
Product Description
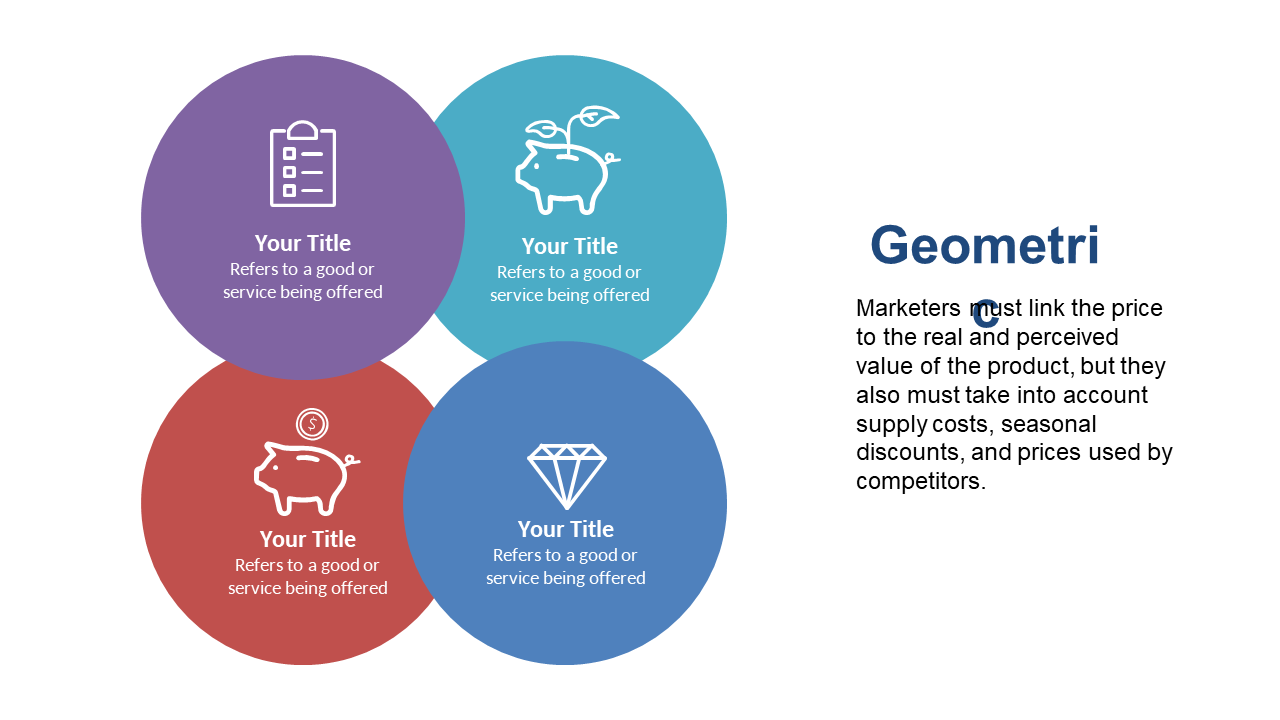
Communicating complex value propositions can often lead to confusion, leaving your audience unclear about essential relationships. This Venn diagram simplifies that communication by presenting interconnected concepts visually, making it easier for stakeholders to understand your key points.
Analysts, marketing professionals, and product developers will find this slide useful during strategy meetings or presentations to clients. If you’re explaining how various features relate to customer benefits or how different products overlap in value, this diagram helps make those connections clear and engaging.
You can download this slide for only $0.99, and it’s ready for quick editing in PowerPoint or Google Slides. Get it now and elevate your presentation in just a few minutes.
$0.99 – Purchase Checkout
Added to cart







