SlideSwift
By Category
💼Business 📊Infographics □Minimal 🕐Timelines ✨Neumorphic 🗑Diagrams 🔄Flow Charts ✨Glassmorphism 🎨Creative 🌍Abstract 🔄Cycle Diagrams 💎Isometric 🖼Illustrations 📱Social Media 🗺MapsBy Slide Type
🚀Pitch Deck 📌Roadmap 🔍SWOT Analysis 📅Timeline 📈Gantt Chart 🏢Org Chart 📋Funnel ⚖Comparison 📄Case Study 📋Agenda ⭐Icons & Lists 👏Thank You
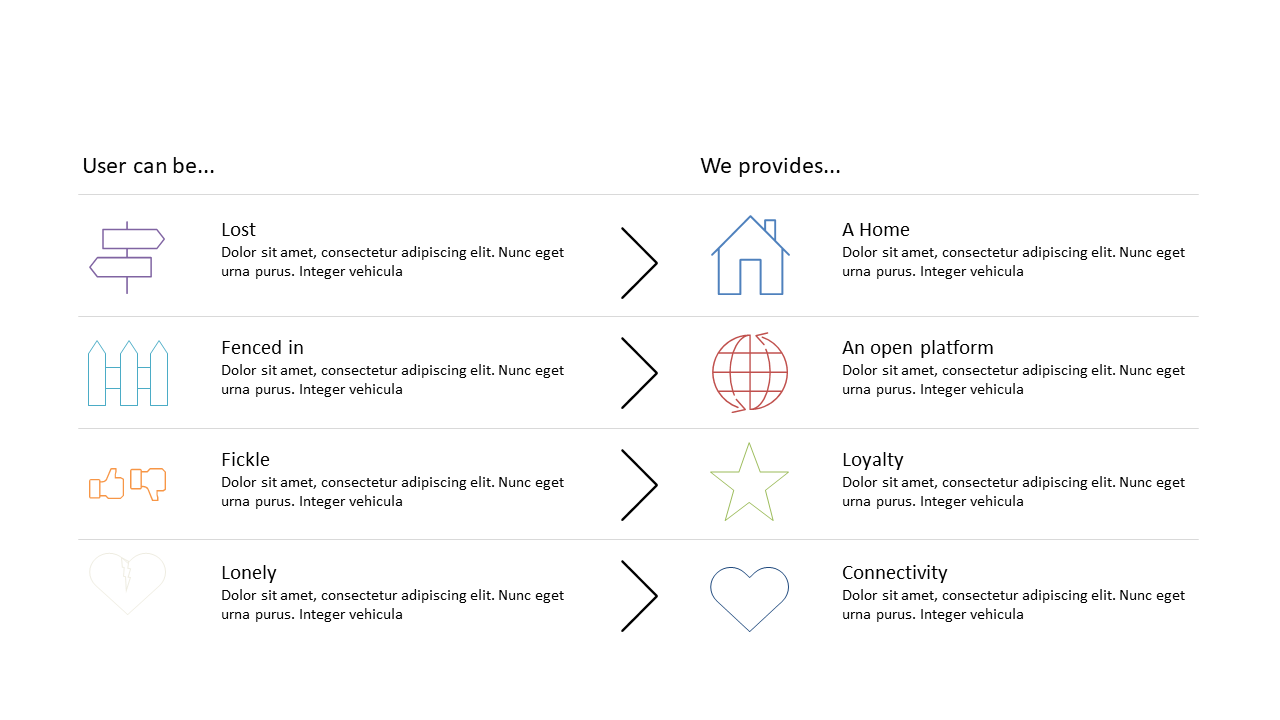
In today’s fast-paced environment, understanding user needs and aligning them with appropriate solutions can be challenging. This slide illustrates a comparison table that outlines user needs alongside the corresponding solutions, featuring a clear directional arrow to guide viewers through the information. The layout is straightforward and easy to follow, making it perfect for presentations where you need to emphasize how your offerings meet customer pain points. A strategy manager could use this slide to effectively present findings during a stakeholder meeting, while an analyst might benefit from showcasing data-driven insights that connect user requirements with available solutions. Similarly, a consultant can leverage this slide to craft compelling narratives that resonate with clients looking for tailored recommendations. Remember, all elements are editable to fit your specific content. $0.99 — add this single slide to any deck from the SlideSwift Slide Library. No subscription needed. Mix slides from any category to build your perfect deck.
Add more from this category to your custom deck