Showcase Usability vs. Design Metrics in Google Slides
Product Description
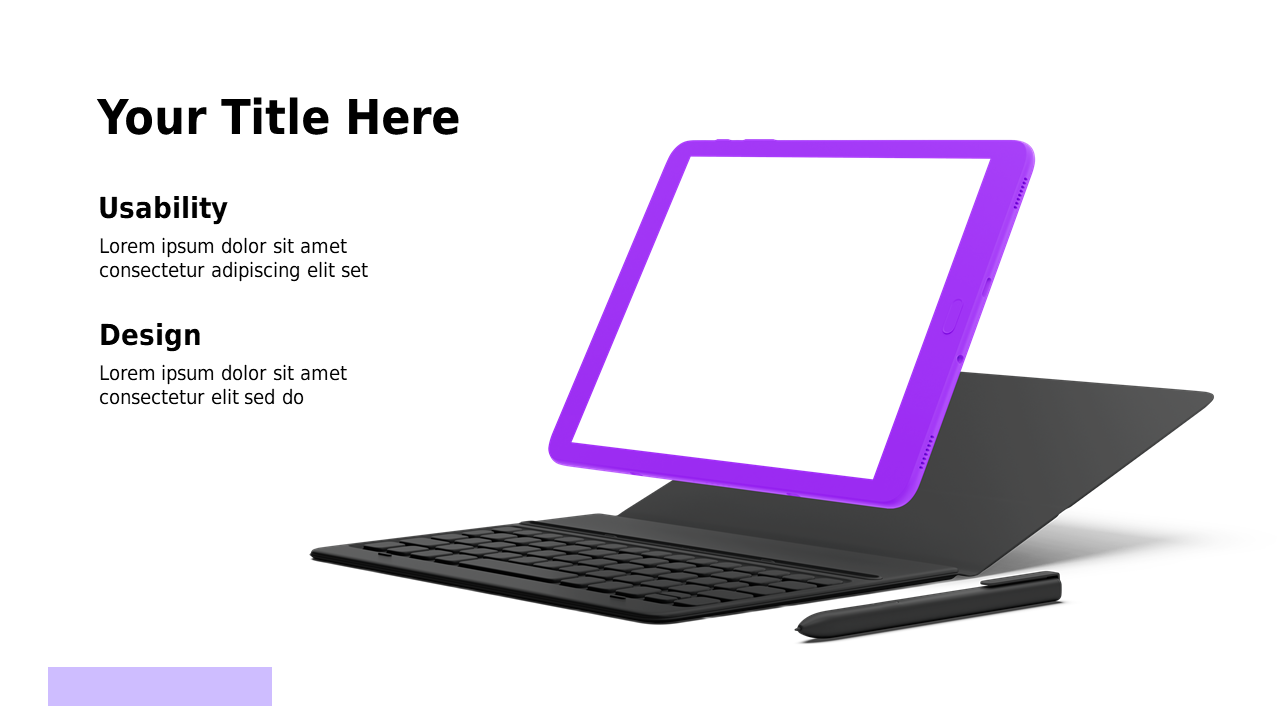
As an analyst, presenting usability against design metrics is vital for illustrating product performance, but it can be challenging to communicate effectively. This slide allows you to display both metrics side by side in a sleek tablet mockup, making it easy for your audience to understand the comparison at first glance.
Use this slide for reporting sessions or team discussions when you need to analyze product effectiveness and bring clarity to your findings. It’s an ideal tool for product managers and data analysts looking to make a compelling case based on metrics.
Available for just $0.99, this slide is ready for immediate download and can be edited in both PowerPoint and Google Slides. You’ll have it customized and ready for your next presentation in no time.
$0.99 – Purchase Checkout
Added to cart







