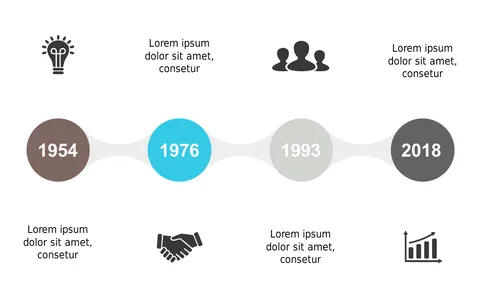
Highlight Events with Triangular Milestone Timeline

Product Description
You often find yourself needing to present a timeline that captures critical milestones in an engaging way. A straightforward list just won’t cut it when you want to emphasize key events across years. This triangular milestone timeline helps you visually highlight significant changes or achievements in your projects or organization.
This slide is perfect for project managers who need to lay out project phases, marketers crafting marketing campaign timelines, or educators discussing historical events. Whether you’re preparing for a quarterly business review or a classroom presentation, this layout makes the information clear and compelling.
At just $0.99, this slide is an instant download ready for immediate use.
You can easily customize it in PowerPoint or Google Slides, adjusting colors and text to fit your specific needs.
$0.99 – Purchase Checkout
Added to cart