Colorful Timeline for Project Milestones Style
Product Description
Keeping your audience engaged during project updates can be difficult, especially when detailing milestones and progress. A confusing timeline can lead to misunderstandings about your project’s status and next steps.
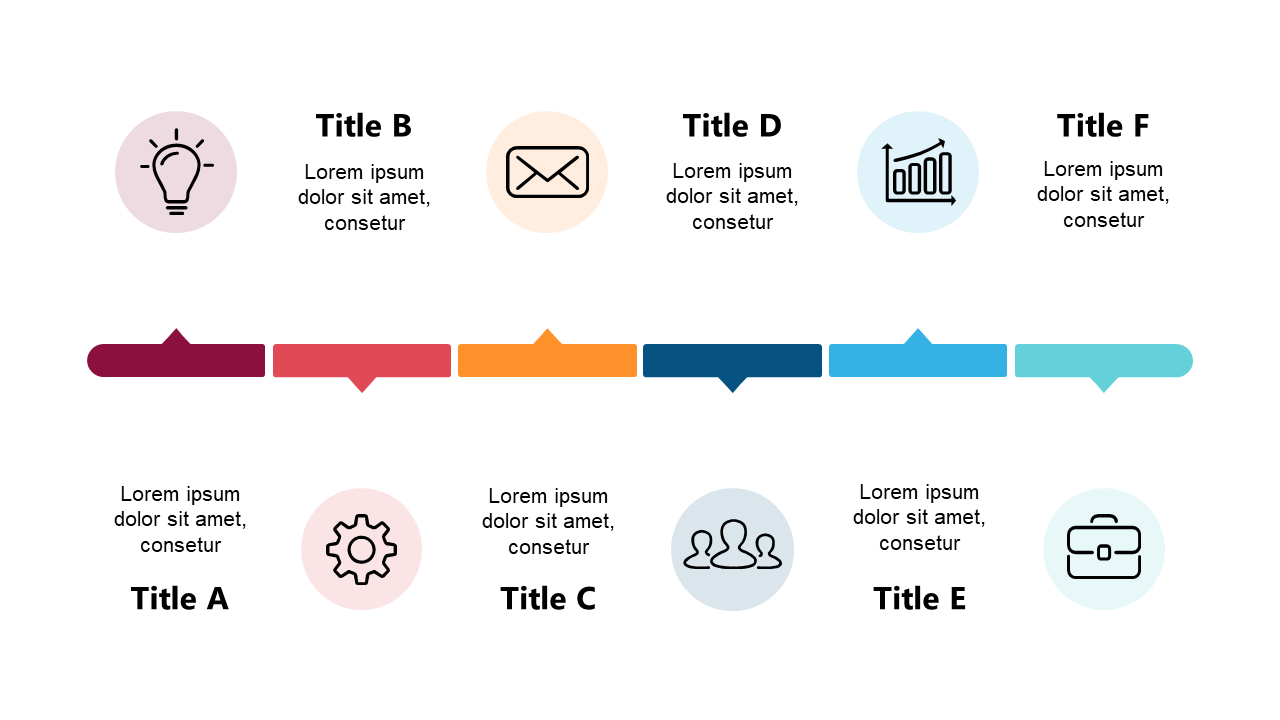
This colorful timeline layout is designed to clearly illustrate key milestones, helping you present information in an engaging way. Ideal for project managers and team leaders, this slide is perfect for status meetings or stakeholder briefings where you need to show progress visually. Whether you’re in construction, tech, or marketing, using this slide will help you communicate timelines effectively to your audience.
At just $0.99, you can download this slide instantly and edit it in PowerPoint or Google Slides. Customize the icons to suit your project, and you’ll be ready to present in minutes.
$0.99 – Purchase Checkout
Added to cart