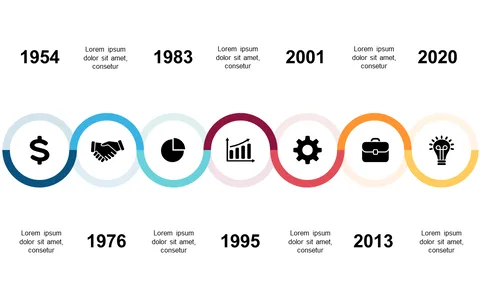
Showcase Milestones with Timeline Icons
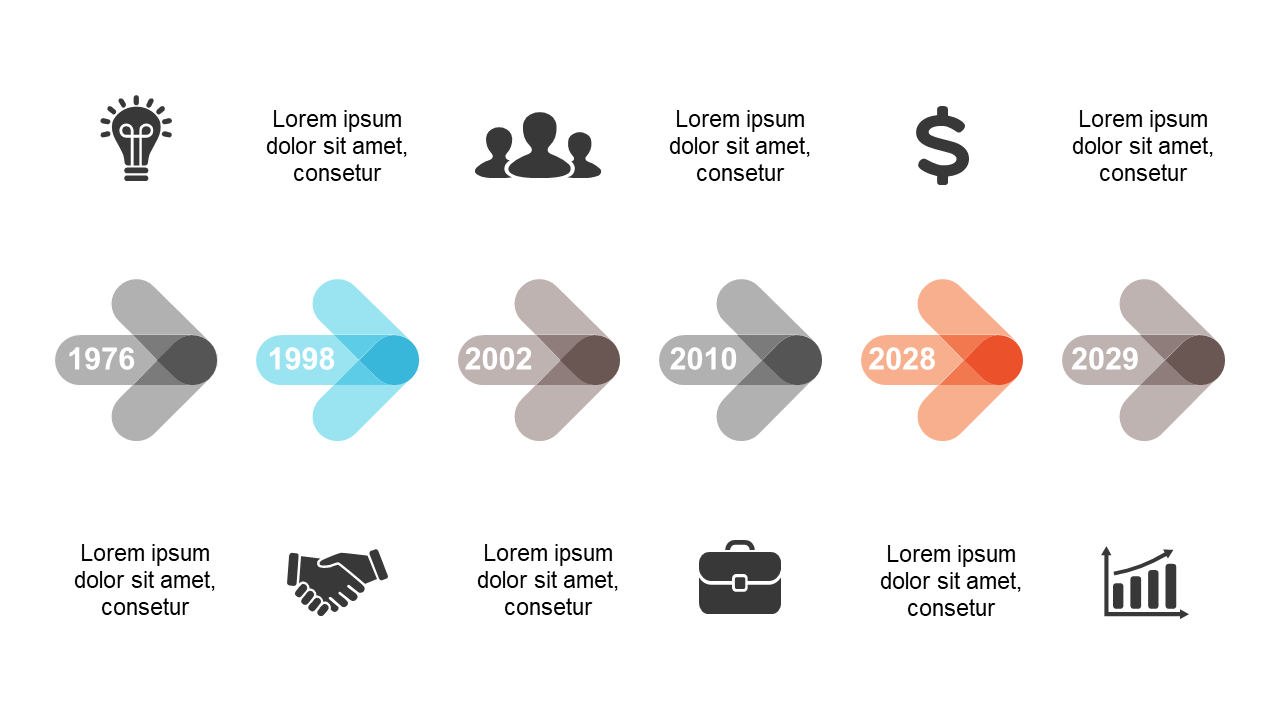
Product Description
When you’re under pressure to meet deadlines, clearly illustrating project timelines can be a game-changer. This slide gives you a neatly organized timeline with icons that represent your key milestones, making it easy for your audience to follow along.
Without visual aids, it’s easy for essential points to get lost during discussions. This slide is great for product managers running sprint reviews, marketing specialists coordinating campaign milestones, or finance teams tracking project deadlines. Use it in client presentations or internal meetings to keep everyone aligned on project progress and timelines.
Available for just $0.99, you can download this slide right away and customize it in PowerPoint or Google Slides. Editing is straightforward, allowing you to tailor it to fit your project details in just a few minutes.
$0.99 – Purchase Checkout
Added to cart