Present Chronological Milestones with Circular Design
Product Description
Conveying a timeline of achievements can often feel overwhelming, especially when trying to present historical data in a clear and engaging way. A cluttered timeline can distract your audience and dilute the impact of your accomplishments.
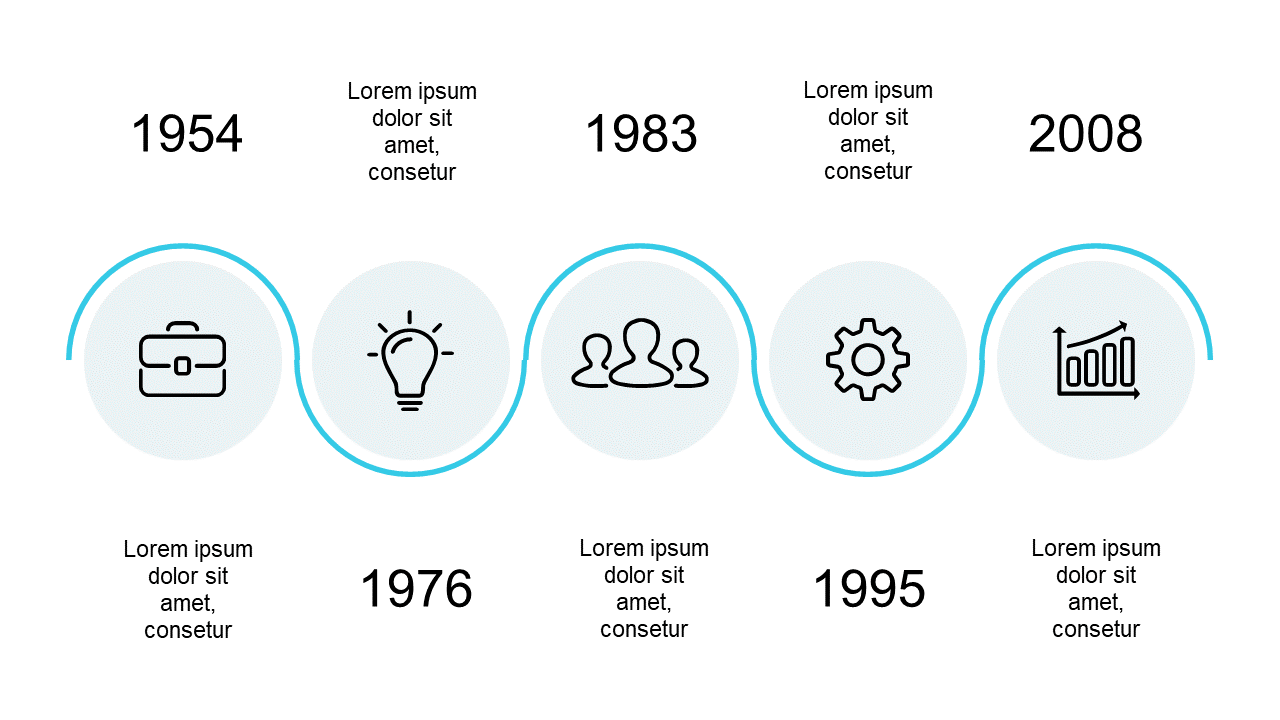
You need a design that organizes key milestones visually and effectively, allowing your listeners to connect the dots easily. This circular timeline layout is perfect for project managers sharing project completion timelines, marketing professionals outlining campaign milestones, or educators presenting historical events. Use it in board meetings, client presentations, or annual reports to highlight your team’s journey or the evolution of a project.
For just $0.99, this slide is ready for instant download and fully editable in both PowerPoint and Google Slides. Customize dates, icons, and descriptions to fit your unique milestones and have a professional presentation ready in minutes.
$0.99 – Purchase Checkout
Added to cart