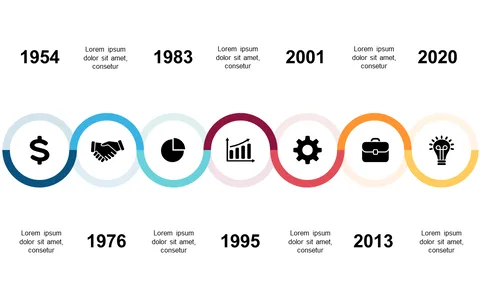
Integrate Milestones with Circular Timeline
Product Description
When you need to present important milestones to your team or stakeholders, clarity is key, but it can often be a challenge to maintain engagement. A complex timeline can confuse rather than inform, leaving your audience lost. This circular timeline integrates milestone highlights with icons to deliver clarity in a captivating format.
Operations managers will find this particularly useful for illustrating project progress during meetings or updates. It’s also great for marketing professionals explaining campaign timelines or educational presentations that require a dynamic approach to historical events.
This format ensures that every important milestone is front and center. At a mere $0.99, this slide offers a quick solution to your presentation needs. It’s instantly downloadable and can be edited easily in PowerPoint or Google Slides, making customization a breeze.
$0.99 – Purchase Checkout
Added to cart