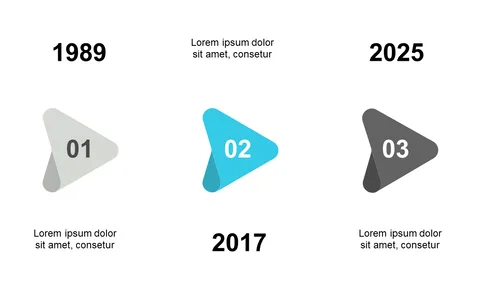
Showcase Key Dates with Triangular Milestone Timeline

Product Description
Project timelines can easily become cluttered, making it difficult for teams to see key dates at a glance. Without a clear visual representation of milestones, keeping everyone aligned on deadlines can feel overwhelming. This triangular milestone timeline organizes your project’s key dates in distinct shapes, simplifying the communication of important events.
Project managers can use this slide to ensure their teams are aware of deadlines during progress meetings, while event coordinators can highlight crucial phases in their planning processes. It’s also an excellent tool for any professional who needs to present timelines in a straightforward yet visually appealing format.
Clear, organized visuals help everyone stay on track and focused. For only $0.99, you can download this slide immediately and customize it in PowerPoint or Google Slides. Tailor the design and text to suit your specific requirements, making your project timelines easy to understand in just a few minutes.
$0.99 – Purchase Checkout
Added to cart