Compare Items with Triangular Analysis Layout
Product Description
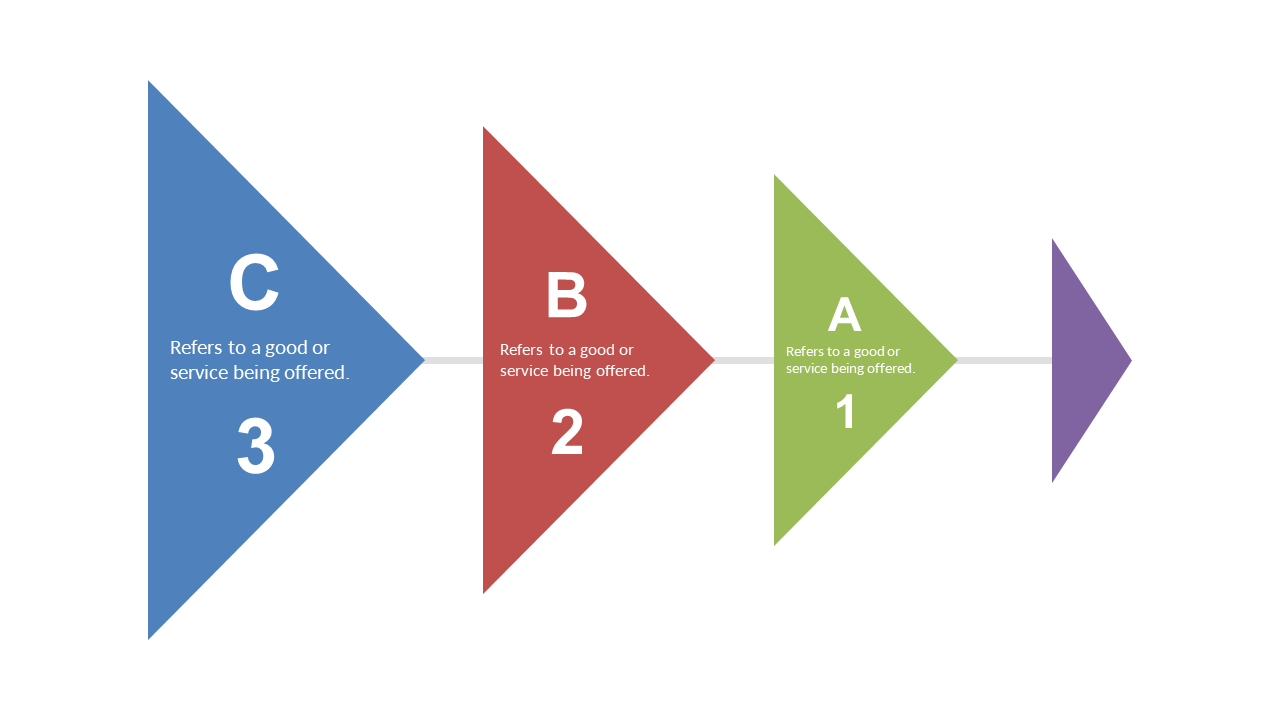
Making informed decisions often hinges on how effectively you can compare multiple options. When you’re faced with choices that require detailed comparisons, having the right visual tool can truly enhance clarity. This triangular analysis layout allows you to present information in a straightforward manner, simplifying the decision-making process for you and your audience.
You can use this slide in a variety of contexts, from marketing teams assessing different strategies to product managers weighing features against competitors. It’s perfect for sales presentations where you need to compare offerings or during team meetings focused on evaluating project options.
The structured design keeps your comparison clean, allowing for quick comprehension. For just $0.99, you can download this customizable triangular analysis layout instantly. It works seamlessly in both PowerPoint and Google Slides, making it simple for you to tailor it to your specific needs and start making those comparisons right away.
$0.99 – Purchase Checkout
Added to cart







