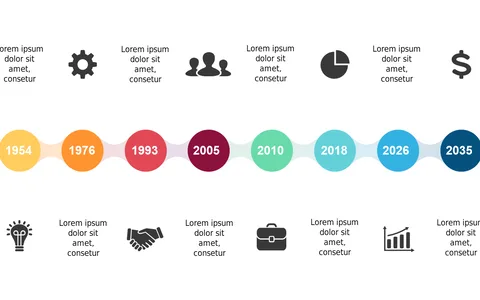
Highlight Achievements with Milestone Circles

Product Description
Staying on top of important milestones can be tough, especially when you’re juggling multiple projects or trying to track historical events. This slide helps you clearly visualize significant achievements over time, allowing your audience to understand the progression of your work or research without getting lost in details.
Project managers, educators, and historians will find this timeline layout particularly useful. Whether you’re reporting on project milestones to your team or presenting historical timelines in a classroom, this slide helps convey your message effectively. You can show off your key achievements in a way that resonates with your audience.
For just $0.99, you can instantly download this editable slide, which works perfectly in both PowerPoint and Google Slides. Simply customize the colors and years to fit your needs, and you’ll be ready to impress in minutes.
$0.99 – Purchase Checkout
Added to cart