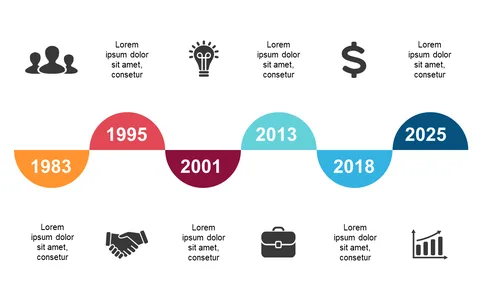
Visualize Historical Progress with Colorful Timeline

Product Description
Conveying historical progress can sometimes feel overwhelming, especially when you need to present a lot of information in an easily digestible format. This timeline slide simplifies that process, using vibrant colors and icons to guide your audience through key events and milestones.
You’ll be able to create a captivating narrative that highlights your achievements and future goals. Ideal for educators, business consultants, or event planners, this slide will enhance presentations that focus on historical timelines, project overviews, or future projections. During board meetings, workshops, or client presentations, you can confidently illustrate your progress and engage your audience with clear visuals that resonate.
You can grab this slide for just $0.99, and it’s ready for instant download. Editing is a breeze in both PowerPoint and Google Slides, letting you customize the content to fit your specific timeline without the hassle of complicated design elements.
$0.99 – Purchase Checkout
Added to cart