Present Comparative Information with a Chevron List V5
Product Description
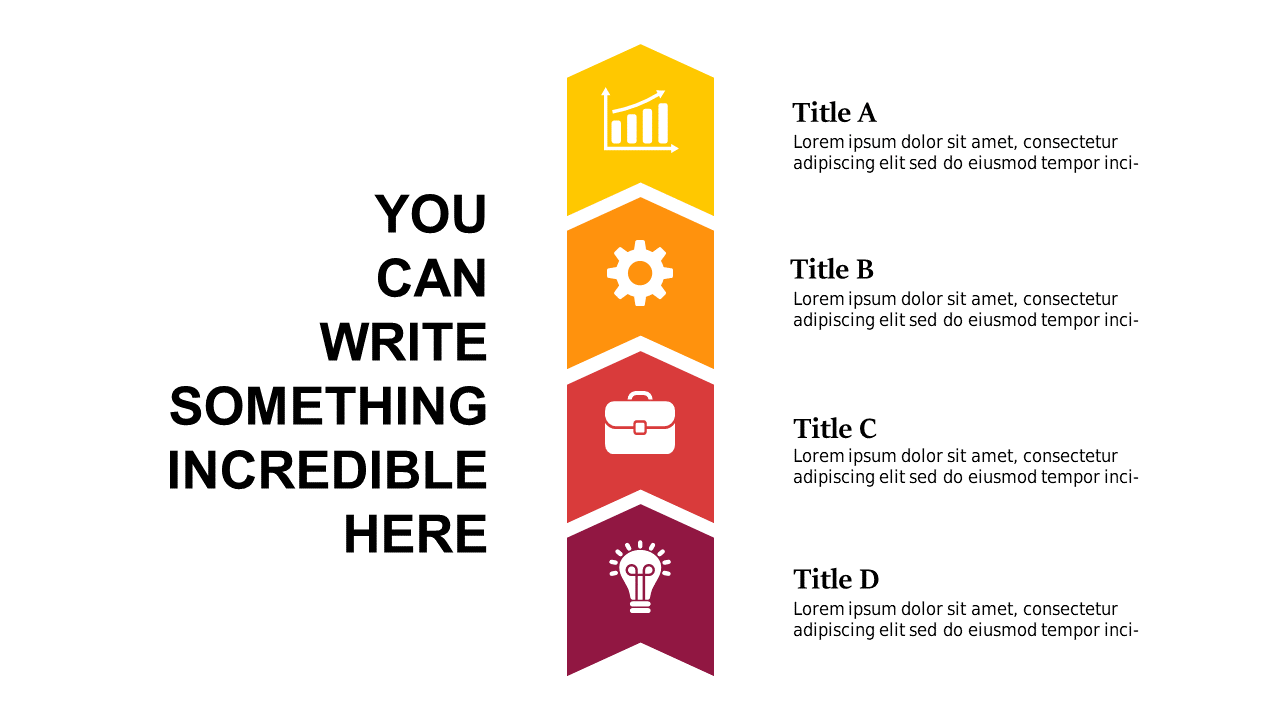
Finding a way to present comparative information clearly can really trip you up. This chevron list slide is designed to break down complex data into three digestible sections, enhancing understanding and retention.
Each section includes icons to support your message, making comparisons easy and visually appealing. This slide is perfect for business analysts, product managers, or project coordinators who need to compare features, pricing, or performance metrics. Use it in review meetings, project updates, or sales pitches to illustrate key differences without overwhelming your audience with dense text.
For only $0.99, you can download this slide instantly. It’s editable in PowerPoint and Google Slides, allowing you to personalize your presentation quickly and efficiently.
$0.99 – Purchase Checkout
Added to cart







