Showcase Features with a Customizable Three-Column Slide
Product Description
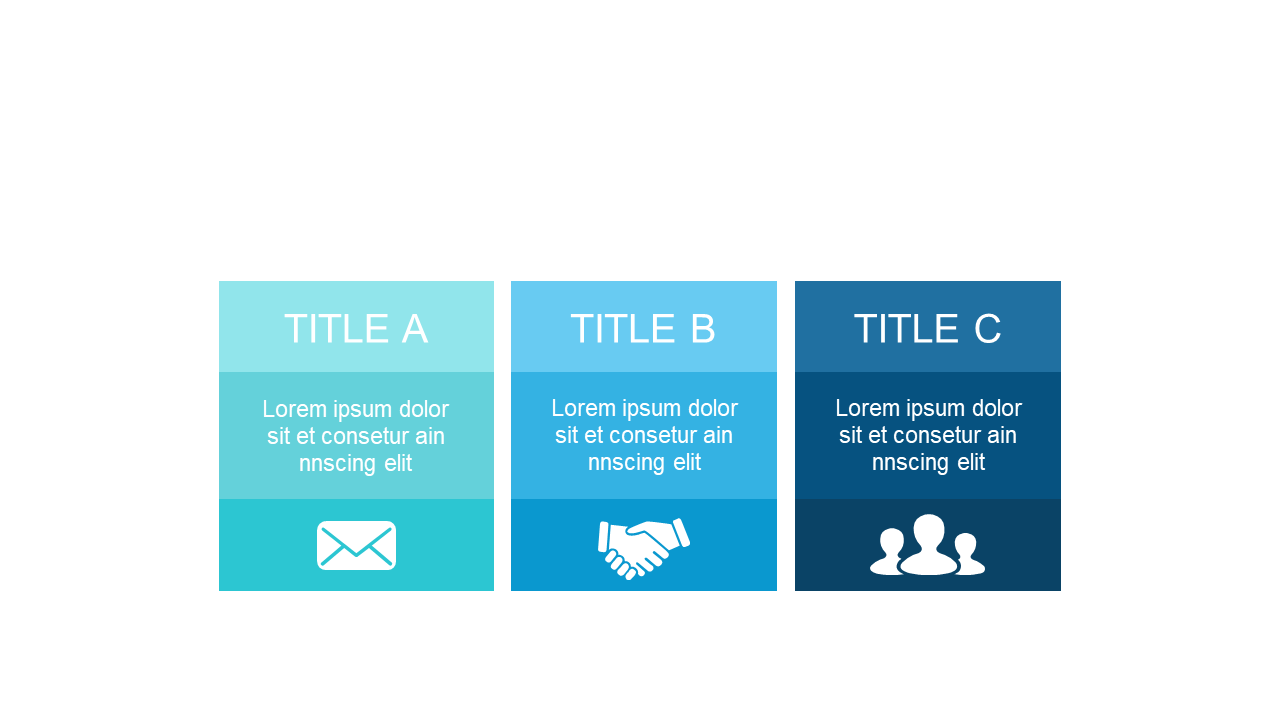
When you’re faced with the challenge of showcasing multiple features clearly, confusion can derail your message. This customizable three-column slide lets you present varied concepts side by side, helping your audience absorb the information quickly.
Ideal for project managers, HR professionals, or tech team leads, this slide can be utilized during product demos, feature discussions, or training sessions. You can easily illustrate differences in software tools, team roles, or project phases for maximum clarity.
For just $0.99, you can download this slide, which is fully editable in PowerPoint and Google Slides. Get started in minutes and make your next presentation visually compelling.
$0.99 – Purchase Checkout
Added to cart
✅ Instant delivery
✅ Fully editable
✅ PowerPoint & Google Slides
Category:
$0.99
Per slide · No minimum · Pay only for what you pick
✓ $0.99/slide
No minimum order
✓ Mix any category
No subscription
Building a full deck?
Mix slides from any of our 58 categories —
all merged into one PowerPoint.
$0.99/slide, no minimum.
Browse All Slides →







