Compare Technology Products Effectively
Product Description
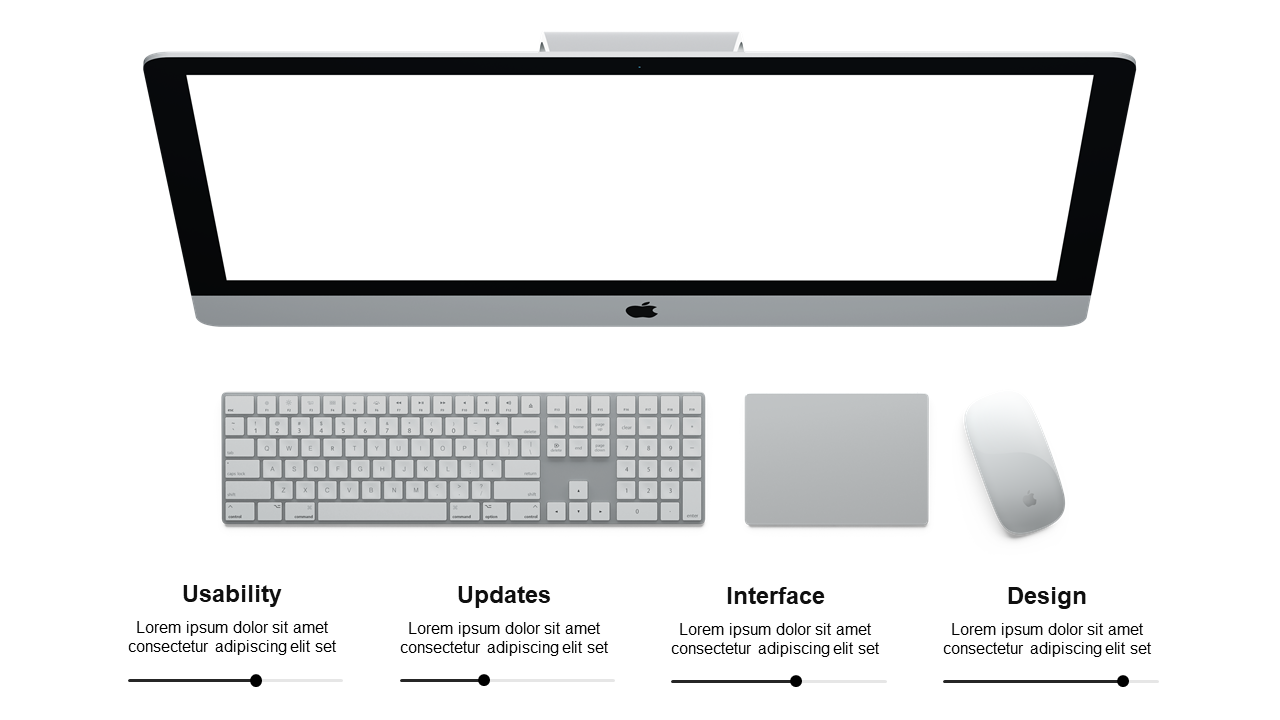
Comparing tech products is often a confusing task, especially when you have so many features to consider. You need a way to present this information clearly without overwhelming your audience with data overload. A side-by-side comparison layout can clarify distinctions and highlight the best features effectively.
Tech evaluators and buyers could use this slide during presentations to stakeholders or clients when discussing product options. It’s perfect for software developers comparing platform features or features during team meetings.
Having a structured visual makes it easier for your audience to grasp the differences at a glance. For just $0.99, you can quickly download this slide and customize it as needed in PowerPoint and Google Slides. The layout is simple to edit, letting you focus on presenting rather than spending hours on design.
$0.99 – Purchase Checkout
Added to cart







