Skills Comparison with Icons for Team Evaluation
Product Description
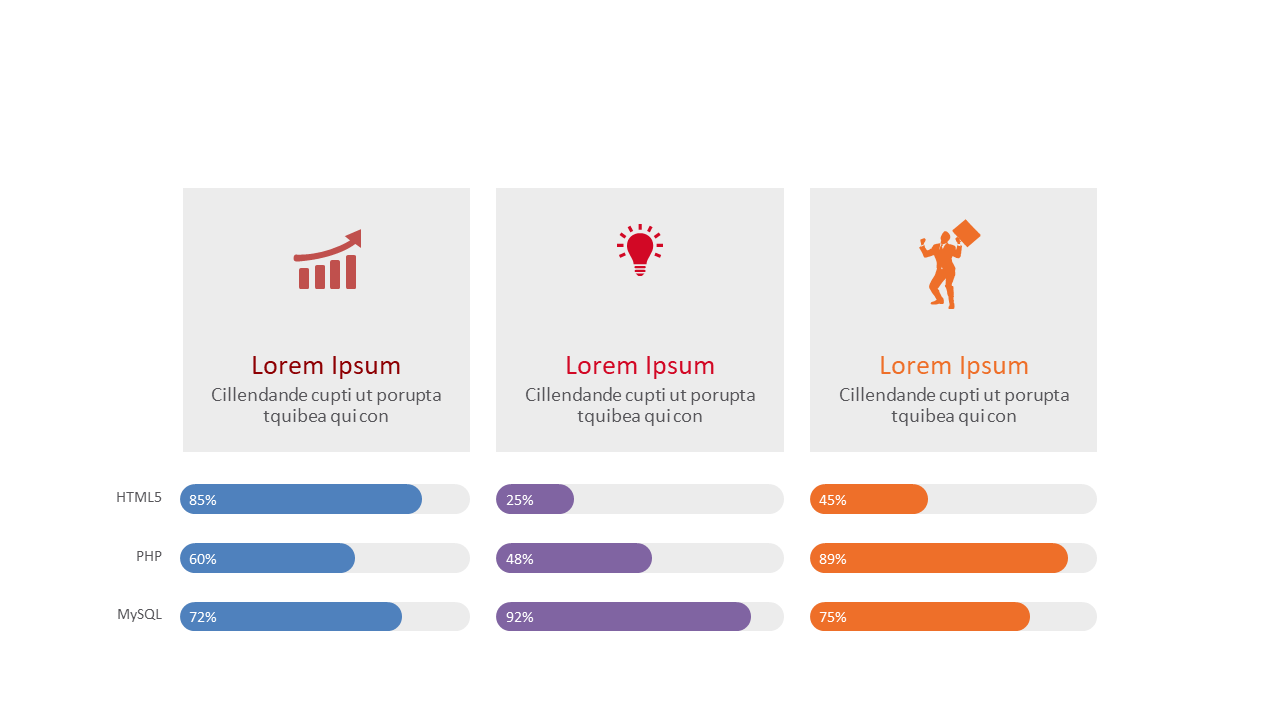
Gathering data to evaluate team skills is crucial, but making that data easily digestible for everyone can be a challenge. This slide simplifies the process by providing a visual comparison of skills through icons and progress bars, allowing you to showcase team proficiencies clearly and attractively.
Human resources professionals conducting performance reviews or team leads assessing skill gaps will find this slide invaluable during evaluation sessions. It’s also fitting for project coordinators who need to illustrate team capabilities and align skill sets with project needs during planning meetings.
You can grab this slide for only $0.99, and it’s available for instant download. Editable in both PowerPoint and Google Slides, it allows for quick customization so you can present skill comparisons in no time.
$0.99 – Purchase Checkout
Added to cart







