Compare Strategies with Quadrant Layout in PowerPoint
Product Description
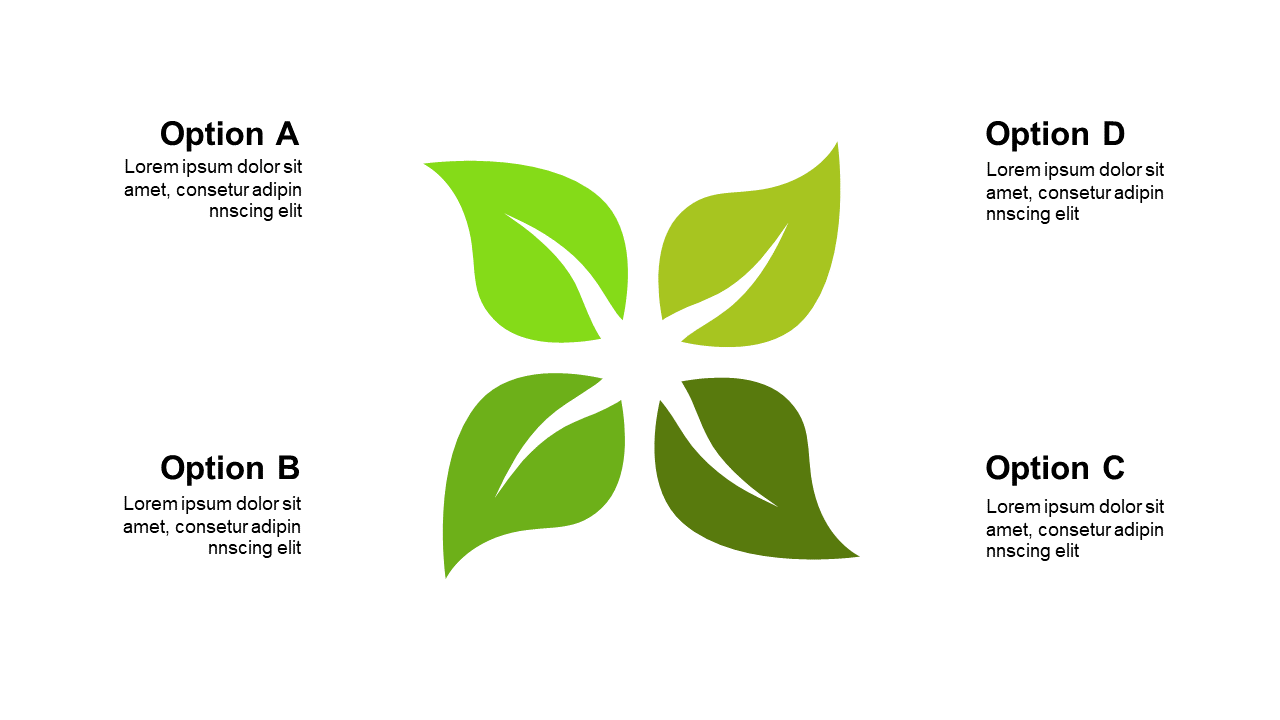
When you need to compare different strategies or products effectively, cluttered slides can hinder understanding. This quadrant layout features a central leaf graphic and four editable text boxes, allowing for a clear and organized comparison that keeps your audience focused.
This layout is especially useful for business analysts assessing various market options or product managers weighing different feature sets. It provides a structured way to present your comparisons during board meetings, strategy sessions, or sales pitches, helping your audience make informed decisions with ease.
At just $0.99, this slide is available for instant download and can be modified quickly in PowerPoint or Google Slides. It’s a straightforward solution for professionals who need to deliver impactful comparisons in a timely manner.
$0.99 – Purchase Checkout
Added to cart







