Compare Products with Central Icon Quadrant Layout
Product Description
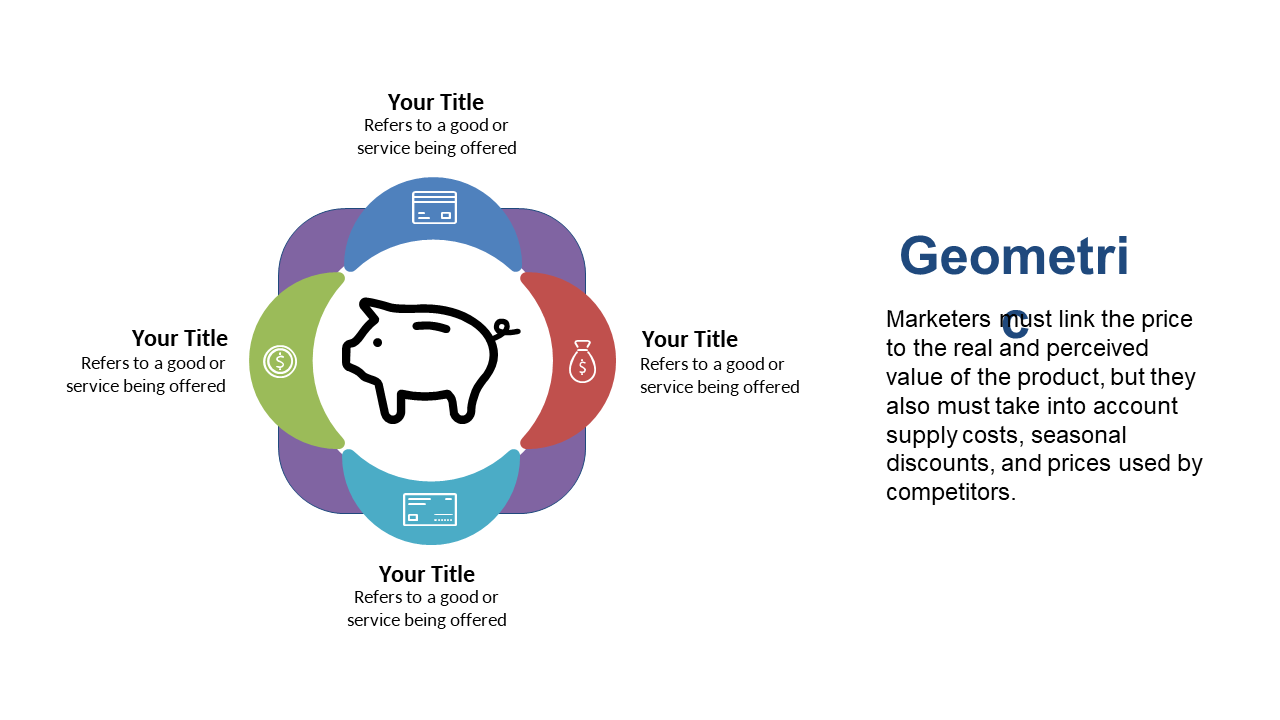
Consultants often struggle with presenting dense information in a way that’s easy to digest. This central icon quadrant layout helps you tackle that challenge by providing a clear structure for comparing multiple products or services at once, allowing your audience to absorb the information effectively.
Business consultants, product marketing managers, or project leads can use this slide during client presentations, product reviews, or team brainstorming sessions. It’s particularly useful in discussions where product comparisons are key to decision-making, as it gives your audience a quick visual reference.
Available for only $0.99, this slide is ready for instant download and is fully editable in PowerPoint and Google Slides.
You can customize it to fit your content and be ready to impress your audience in a matter of minutes.
$0.99 – Purchase Checkout
Added to cart







