Compare Categories with a Triangular Design
Product Description
Making decisions often feels overwhelming when you need to compare multiple categories. Presenting that data effectively can be a challenge, especially when you want to highlight both differences and similarities.
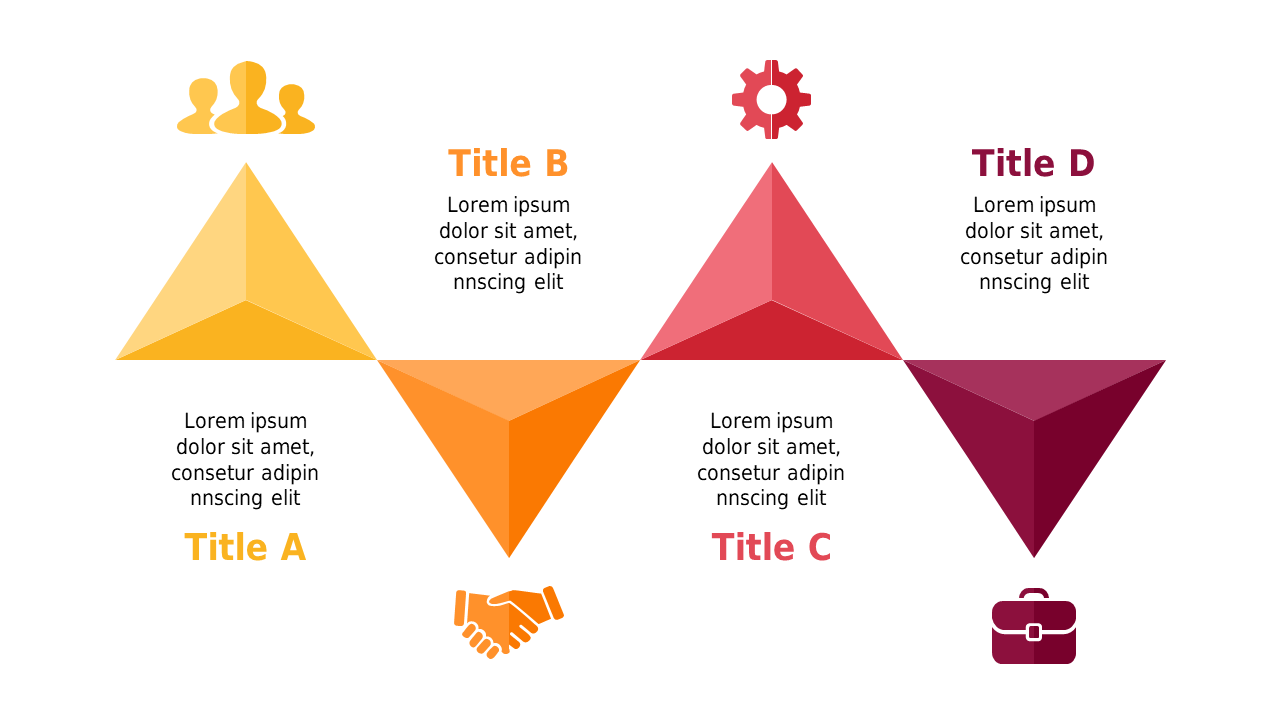
This triangular comparison slide simplifies that process, providing a clear visual representation that engages your audience. Marketing managers analyzing product features, project coordinators comparing timelines, or sales teams evaluating competitor offerings will find this slide particularly useful. You can use it during product launches, strategic planning sessions, or team discussions to illustrate how various categories align or diverge.
For just $0.99, you can download this slide instantly. It’s easy to edit in PowerPoint and Google Slides, allowing you to adapt it to your needs in just minutes.
$0.99 – Purchase Checkout
Added to cart







