Compare Options with Overlapping Circles Layout
Product Description
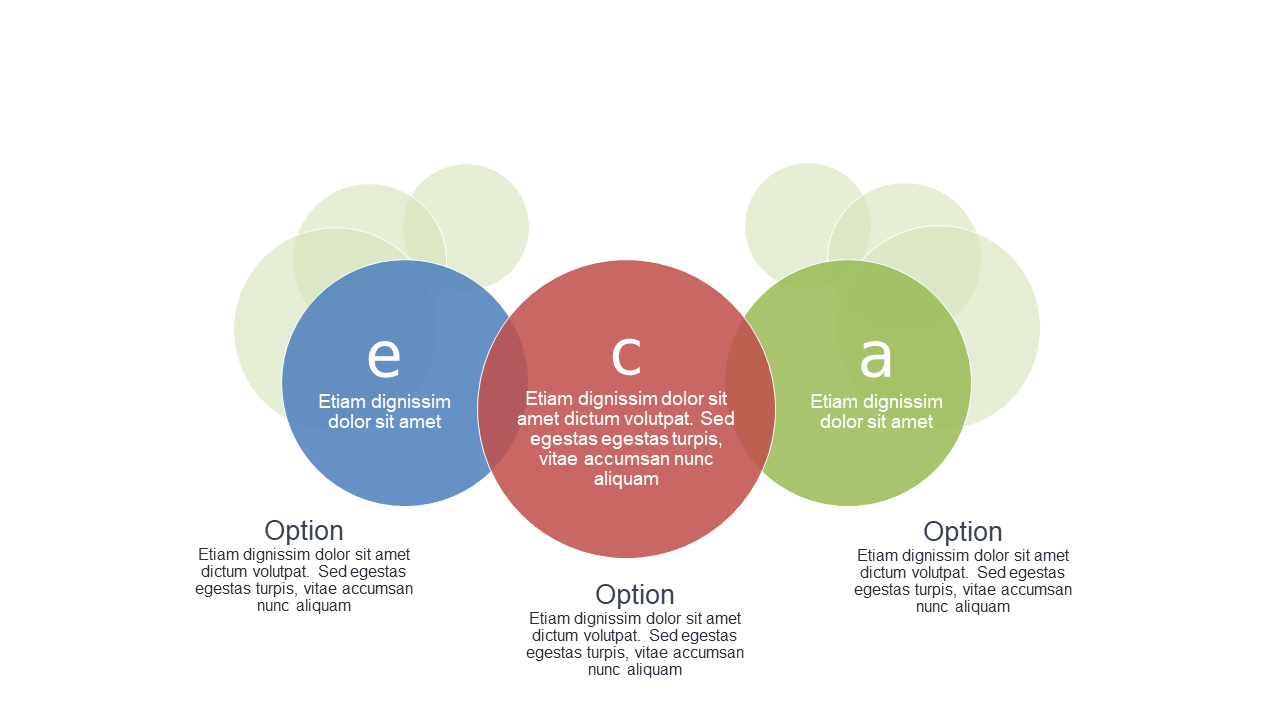
Sorting through multiple options can be overwhelming for any audience, making it essential to present choices clearly and effectively. This overlapping circles layout simplifies comparisons, allowing you to showcase features or benefits side by side.
It takes complex information and transforms it into an easily understandable visual format. Business strategists, product managers, and financial advisors will find this slide invaluable during decision-making meetings, product comparisons, or client consultations. It enables you to convey the pros and cons of different options succinctly, helping your audience make informed choices.
At just $0.99, this slide is ready for instant download and can be easily edited in PowerPoint or Google Slides. You’ll have a clean and professional comparison tool at your fingertips within minutes.
$0.99 – Purchase Checkout
Added to cart







