Present Geographical Data with Germany Map
Product Description
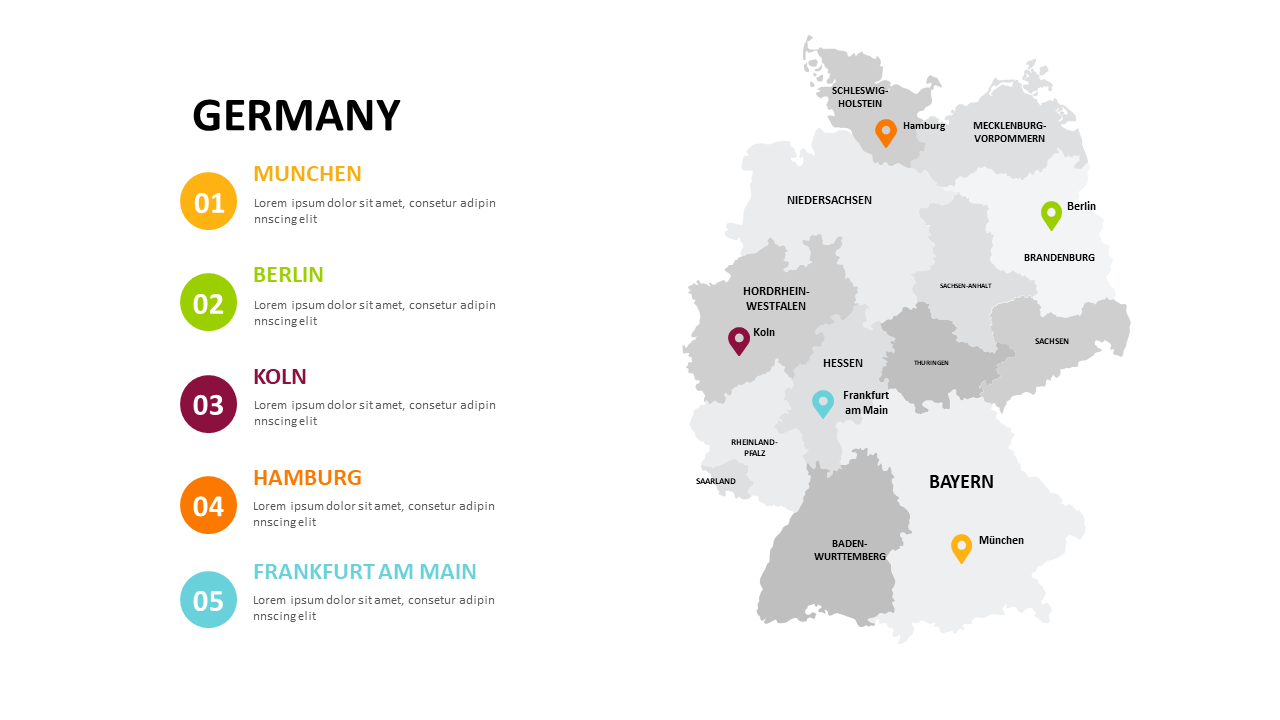
Presenting geographical data can often lead to misunderstandings if the visuals are not clear. This slide features a detailed map of Germany, marking key cities and regions, making it straightforward for your audience to grasp essential information quickly.
This is perfect for data analysts presenting market research, real estate agents showcasing property locations, or educators teaching about the country’s geography. The clarity of this map helps ensure that your audience retains the crucial points you want to convey.
For just $0.99, this slide is ready for instant download and can be easily customized in both PowerPoint and Google Slides. You can modify it in minutes to suit your presentation needs.
$0.99 – Purchase Checkout
Added to cart