Multi-Box Comparison Layout for Key Points
Product Description
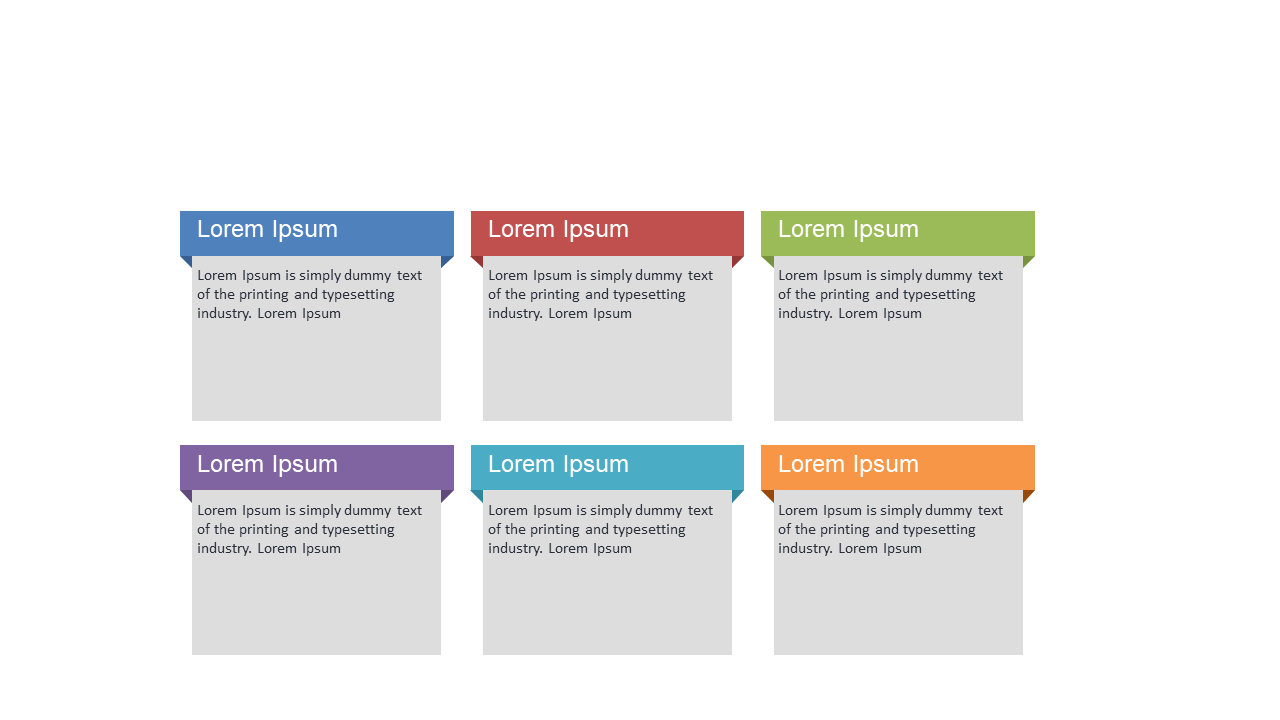
When exploring multiple options, presenting key points in a clear and organized manner is crucial to avoid confusion. This slide provides a multi-box comparison layout that facilitates side-by-side analysis, helping your audience easily compare different aspects of a topic.
Business analysts preparing reports or sales teams presenting product options will find this slide particularly beneficial during meetings. It’s perfect for strategy sessions where you need to weigh pros and cons or compare product features in a straightforward way.
You can download this slide for just $0.99, and it’s easily editable in both PowerPoint and Google Slides. Get started quickly to create a polished presentation that makes your comparisons crystal clear.
$0.99 – Purchase Checkout
Added to cart







