Compare Mobile Devices with Performance Metrics
Product Description
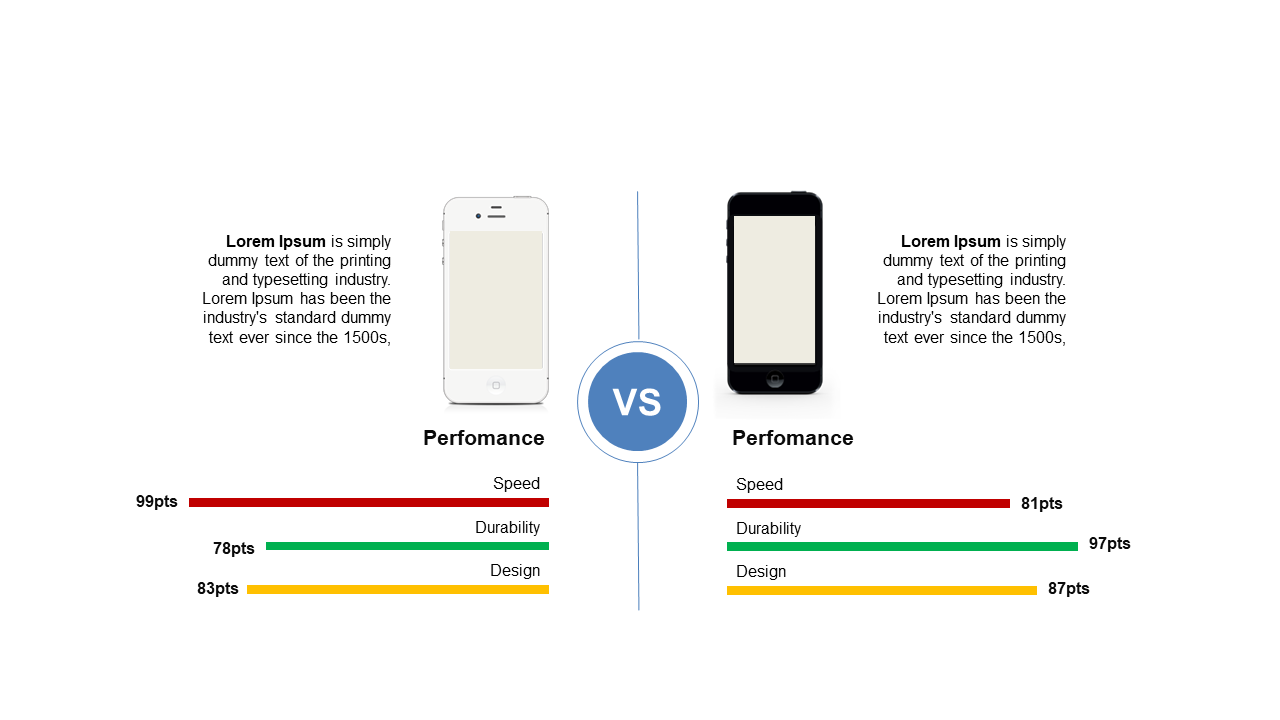
Keeping track of multiple mobile devices can feel overwhelming, especially when you need to compare their performance metrics at a glance. Without a straightforward way to see how they stack up against each other, you risk making decisions based on incomplete information. This slide takes away that stress by providing a clear side-by-side comparison of essential metrics like speed, durability, and design.
This slide is perfect for analysts in the tech industry, mobile device sales representatives, or product managers who need to present their findings in meetings or reports. Whether you’re conducting a competitive analysis, preparing for a product launch, or simply looking to inform your team about the latest offerings, this slide will make your data relatable and easy to understand.
For just $0.99, you can download this slide and have it ready in no time. It’s fully editable in PowerPoint and Google Slides, so
you can customize it to fit your specific needs and make it your own with minimal effort.
$0.99 – Purchase Checkout
Added to cart







