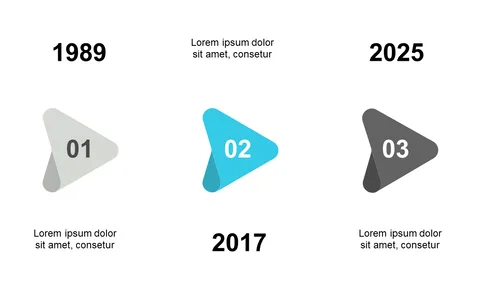
Present Key Events with Milestone Timeline Infographic

Product Description
Communicating timeline milestones effectively can be a headache for program managers. You often find yourself trying to share key achievements, only for your audience to become overwhelmed by cluttered visuals or vague details.
This milestone timeline infographic brings clarity and engagement, making each important event easily identifiable. This slide is perfect for program managers presenting project updates, marketing managers sharing campaign timelines, or even product owners detailing development phases. Whether you’re in a strategy meeting, a client briefing, or a team retrospective, this timeline will help you keep everyone on the same page without the confusion.
At just $0.99, you can download this slide instantly and customize it in PowerPoint or Google Slides. It’s designed for easy editing so you can have your presentation ready in no time.
$0.99 – Purchase Checkout
Added to cart