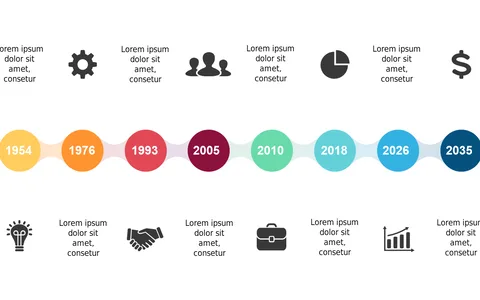
Visualize Progress with Milestone Infographics

Product Description
Articulating progress can be particularly challenging in an operations review, where clarity is essential. A well-structured visual can transform your communication and help ensure your audience understands your milestones.
This milestone infographic delivers a clean and engaging layout that captures attention and drives comprehension. Perfect for operations managers reporting on progress during strategic meetings, project coordinators summarizing key phases, or business analysts presenting data trends, this slide is designed to make your milestones clear and memorable. Each marker helps your audience follow the narrative seamlessly while appreciating the significance of each achievement.
For only $0.99, you can download this slide instantly, making it easy to customize in PowerPoint or Google Slides. Show your progress effectively and enhance your presentations with this straightforward and effective design!
$0.99 – Purchase Checkout
Added to cart