Visual Comparison Template in Leaf Shape
Product Description
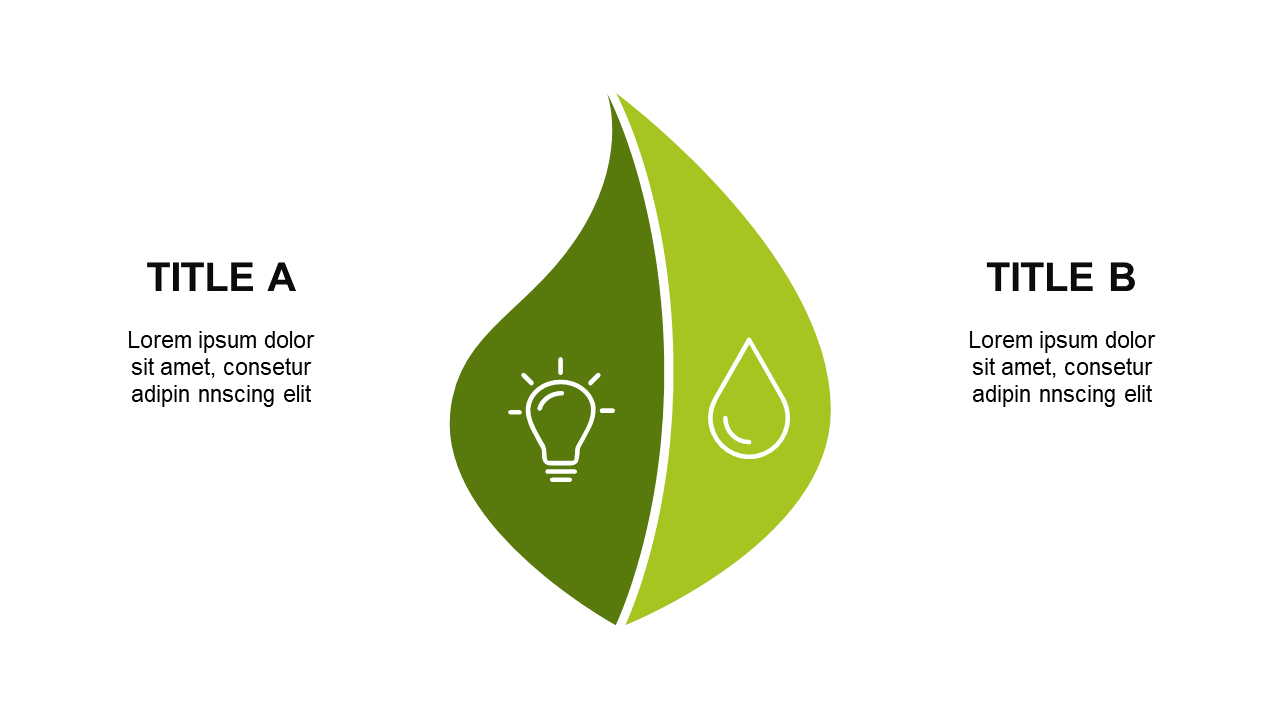
Effectively illustrating contrasting information can be a challenge, especially when you want to keep your audience engaged. This visual comparison template allows you to showcase two different ideas or products side by side in a way that’s visually appealing and easy to understand. The leaf shape creates a memorable context while providing a clear structure for your comparison.
This slide is perfect for business analysts presenting market trends, sales teams comparing product options, or educators contrasting different teaching methods. It can also be useful for project managers who need to outline the pros and cons of various strategies in a team meeting.
Each scenario benefits from a clear visual representation of comparisons, making this slide a valuable tool. For only $0.99, you can download this slide instantly and customize it as needed. It’s ready for use in both PowerPoint and Google Slides, ensuring that you can adjust the content quickly and easily to fit your specific requirements.
$0.99 – Purchase Checkout
Added to cart







