Contrast Innovative Ideas with Growth Metrics V4
Product Description
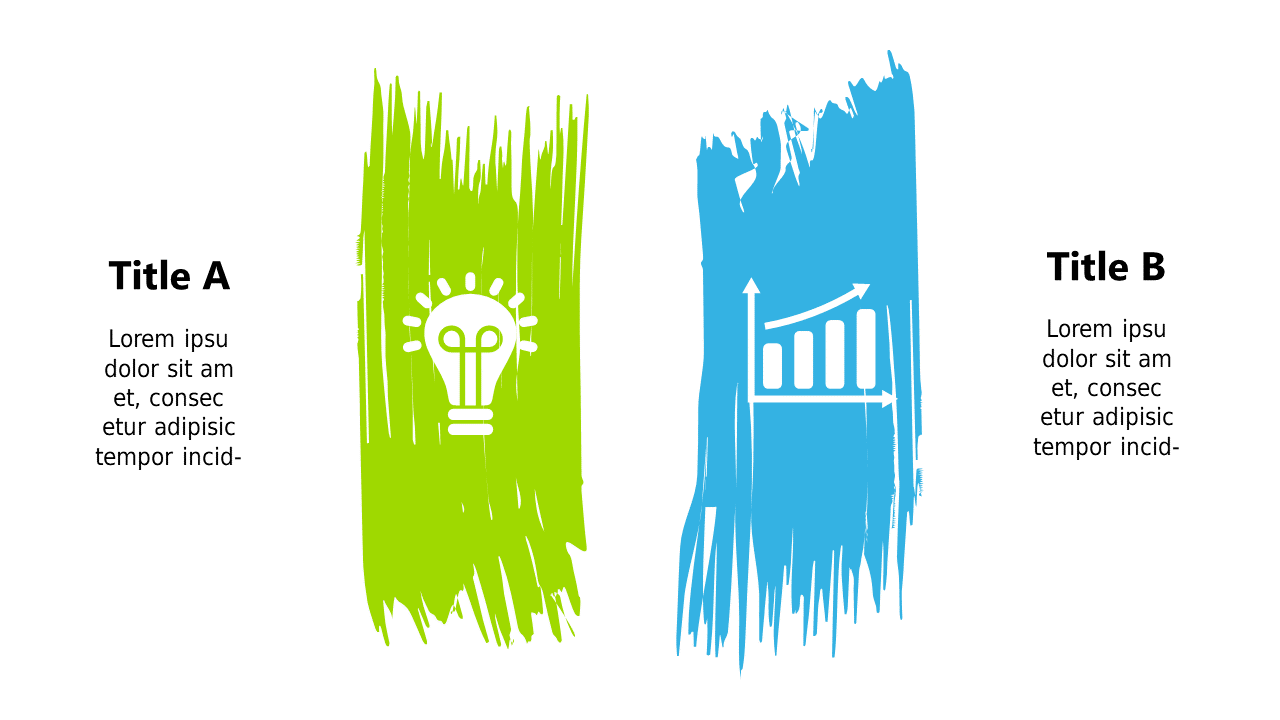
Presenting contrasting elements like innovative ideas and growth metrics can be daunting, especially when clarity is key. This slide provides a visually compelling side-by-side layout that highlights the differences in a way that’s easy to digest. You’ll find it an invaluable tool in making sure your key points resonate with your audience.
Consider this slide for use by financial analysts when pitching new investment ideas alongside historical growth data in stakeholder meetings. Entrepreneurs can also benefit from it when showcasing new business concepts against revenue metrics during pitch competitions.
The distinct colors and icons allow for immediate recognition of key points. For just $0.99, this slide is available for instant download and easy editing in both PowerPoint and Google Slides. Customize it quickly to align with your specific presentation needs and make your ideas shine.
$0.99 – Purchase Checkout
Added to cart