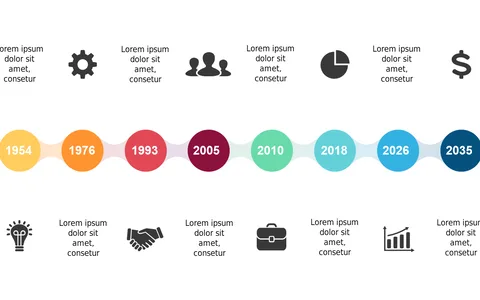
Showcase Yearly Milestones in a Timeline

Product Description
Effectively showcasing progress in project management can be a challenge when deadlines are tight and updates are frequent. A visual representation of your yearly milestones can help your audience quickly understand where you stand and what comes next.
This timeline slide is perfect for project managers, team leaders, or program coordinators who need to present key milestones in team meetings or progress reports. It offers a clear view of achievements over time, making it easier to communicate updates to your team or stakeholders.
You can purchase this slide for only $0.99, and it’s ready for instant download. Editing is a breeze in PowerPoint or Google Slides, allowing you to tailor it to your project specifics.
$0.99 – Purchase Checkout
Added to cart