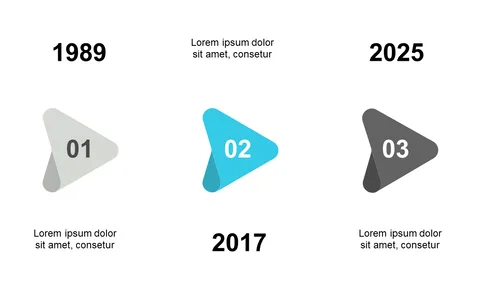
Present Key Events with Horizontal Timeline Layout

Product Description
Keeping track of key events in your projects can be daunting, especially when you have a lot of milestones to present. This horizontal timeline layout simplifies your storytelling by visually mapping out significant moments, helping your audience follow along without getting lost in details.
Ideal for project managers or team leaders in industries like marketing or software development, this slide is perfect for workshops, status updates, or quarterly reviews. You can easily illustrate project timelines during client presentations or showcase your department’s achievements in stakeholder meetings.
For just $0.99, you can download this slide instantly and make it your own. It’s straightforward to edit in PowerPoint or Google Slides, so
you can customize it to fit your specific needs within minutes.
$0.99 – Purchase Checkout
Added to cart