Showcase Project Milestones with Horizontal Timeline Style

Product Description
Managing multiple projects simultaneously can create a need for clarity in how you showcase milestones. Without a clear visual representation, it’s easy to lose track of significant events and their timelines.
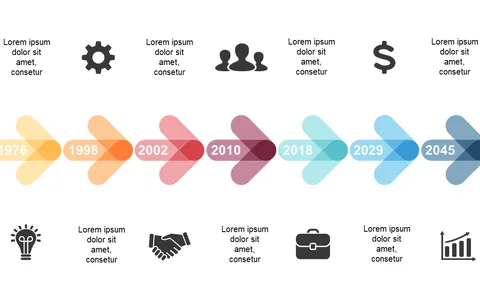
This horizontal timeline slide provides a structured and organized way to display project milestones, allowing your audience to quickly grasp the flow of your work. Program managers and team leaders can utilize this slide during status updates or project retrospectives, where showcasing timelines is essential for keeping teams aligned. In industries like software development and marketing, delivering a clear picture of past achievements and upcoming milestones can drive collaboration and accountability among team members.
Available for just $0.99, this slide is ready for immediate download and can be easily customized in PowerPoint and Google Slides. Spend just a few minutes editing it to meet your needs, and you’ll be set for a successful presentation that keeps your audience informed and engaged.
$0.99 – Purchase Checkout
Added to cart