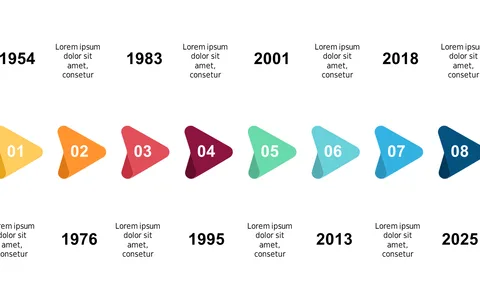
Showcase Milestones with Colorful Timeline V2
Product Description
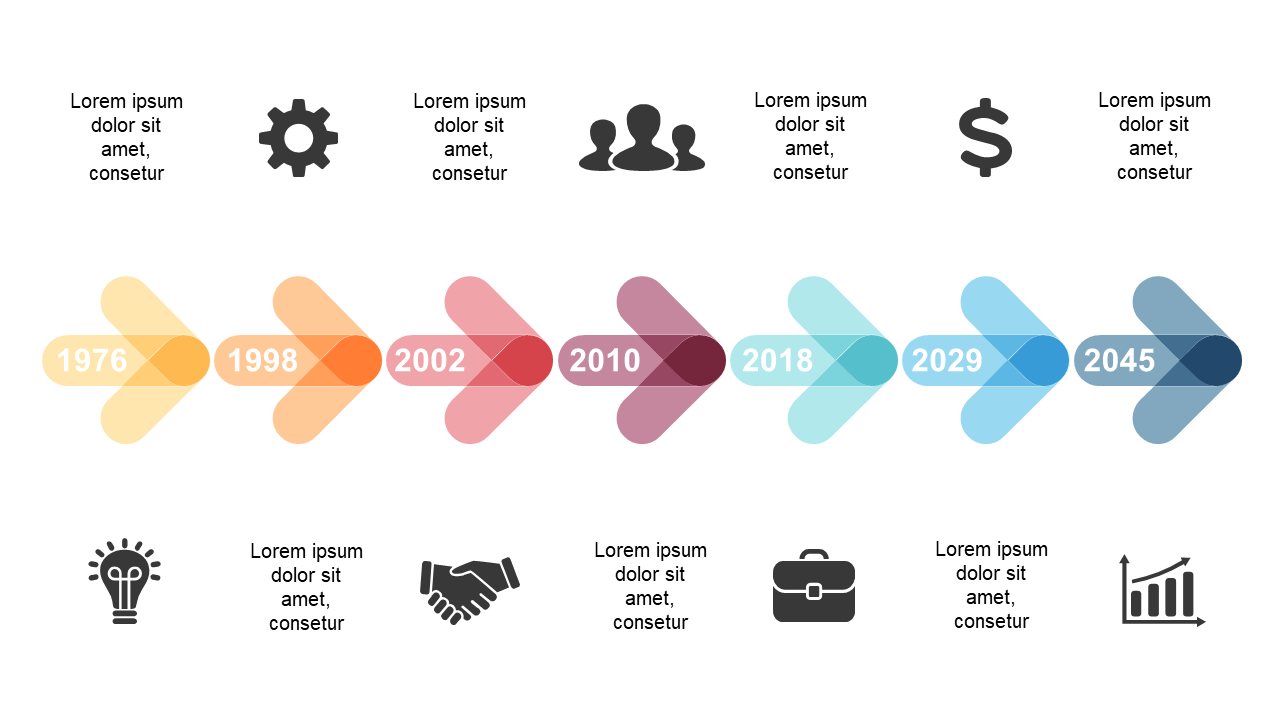
Finding a visually appealing way to share milestones can be a challenge, especially when you want to grab your audience’s attention. This slide makes it straightforward to map out important dates and events with colorful icons, ensuring your key points are communicated clearly. You’ll be able to highlight specific achievements while keeping your presentation dynamic.
This slide is a perfect fit for business analysts, marketing professionals, or operations managers looking to present historical data or project developments in meetings or reports. Whether you’re running a quarterly review or a team strategy session, this visual aid will help you tell your project’s story effectively.
The eye-catching design is sure to engage colleagues and stakeholders alike. At just $0.99, this slide is available for immediate download and is fully editable in PowerPoint and Google Slides. You can quickly modify the years, icons, and text, allowing you to tailor it to your specific needs without wasting time on complicated design work.
$0.99 – Purchase Checkout
Added to cart