Showcase Milestones with Horizontal Timeline Layout

Product Description
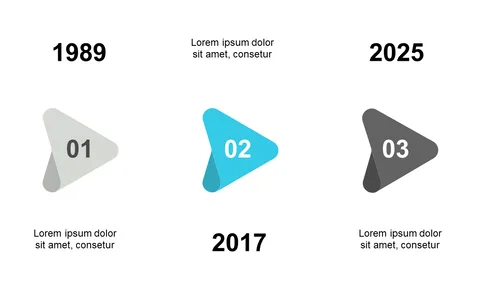
It can be tough for operations managers to effectively communicate project timelines, especially when dealing with multiple milestones. This slide offers a visually appealing horizontal timeline that integrates significant dates and icons, making it easier for your audiences to see the big picture at a glance.
Operations managers and project coordinators will find this slide handy during project kickoff meetings or progress reports. It’s ideal for illustrating the timeline of a project, showcasing crucial milestones and deadlines, and ensuring that everyone is on the same page regarding project status.
You can grab this slide for just $0.99, and it will be ready for instant download. It’s fully editable in both PowerPoint and Google Slides, allowing you to tailor it to your project in just moments.
$0.99 – Purchase Checkout
Added to cart