Compare Products Effectively with Horizontal Chart Layout
Product Description
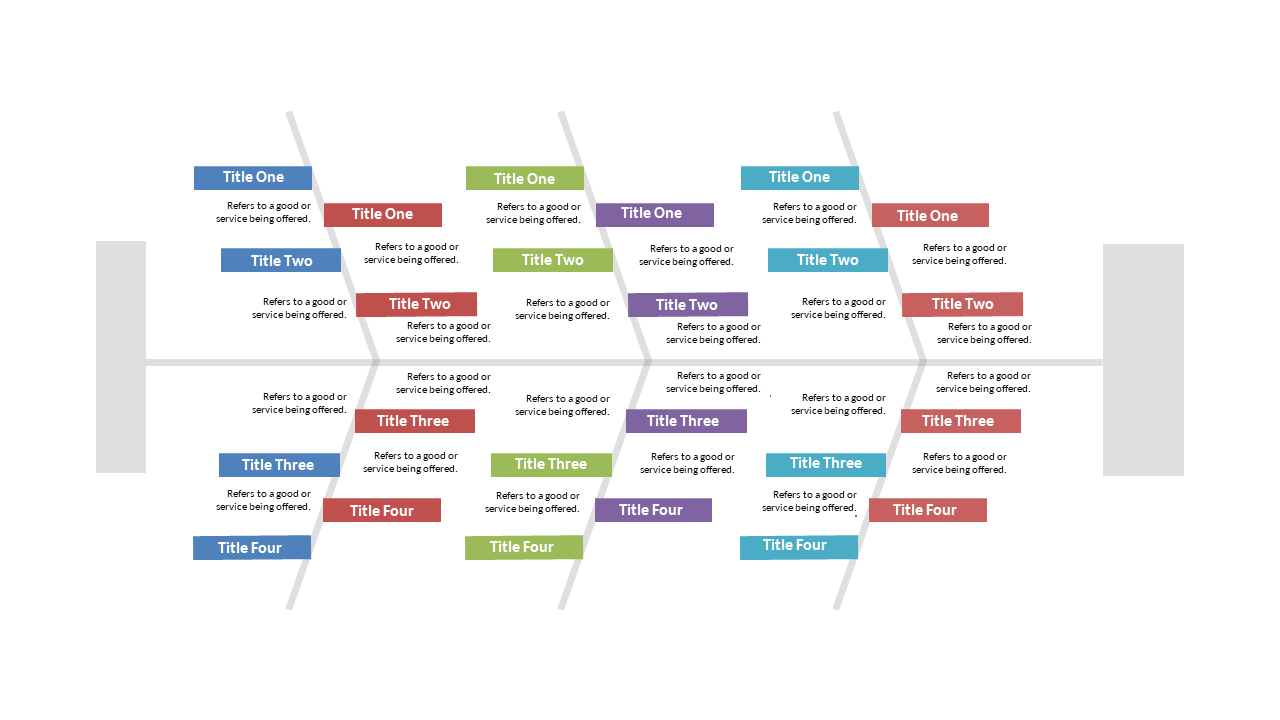
When comparing multiple products, it’s vital to present the information clearly to avoid confusion. This horizontal comparison chart allows you to showcase products effectively, making distinctions between them straightforward.
Your audience will appreciate the clarity, helping them make informed choices. This slide is perfect for sales reps comparing product features, marketing teams discussing competitive advantages, or business analysts evaluating product lines. Its clean, colorful layout draws attention to key differences, making your presentation more persuasive and engaging.
For only $0.99, you can download this slide instantly and customize it in PowerPoint or Google Slides. You’ll be ready to present in just minutes, making it a great addition to your toolkit.
$0.99 – Purchase Checkout
Added to cart







