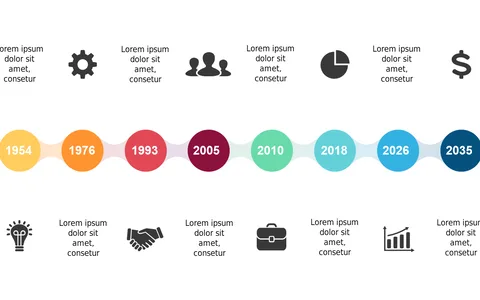
Engaging Horizontal Timeline for Key Milestones
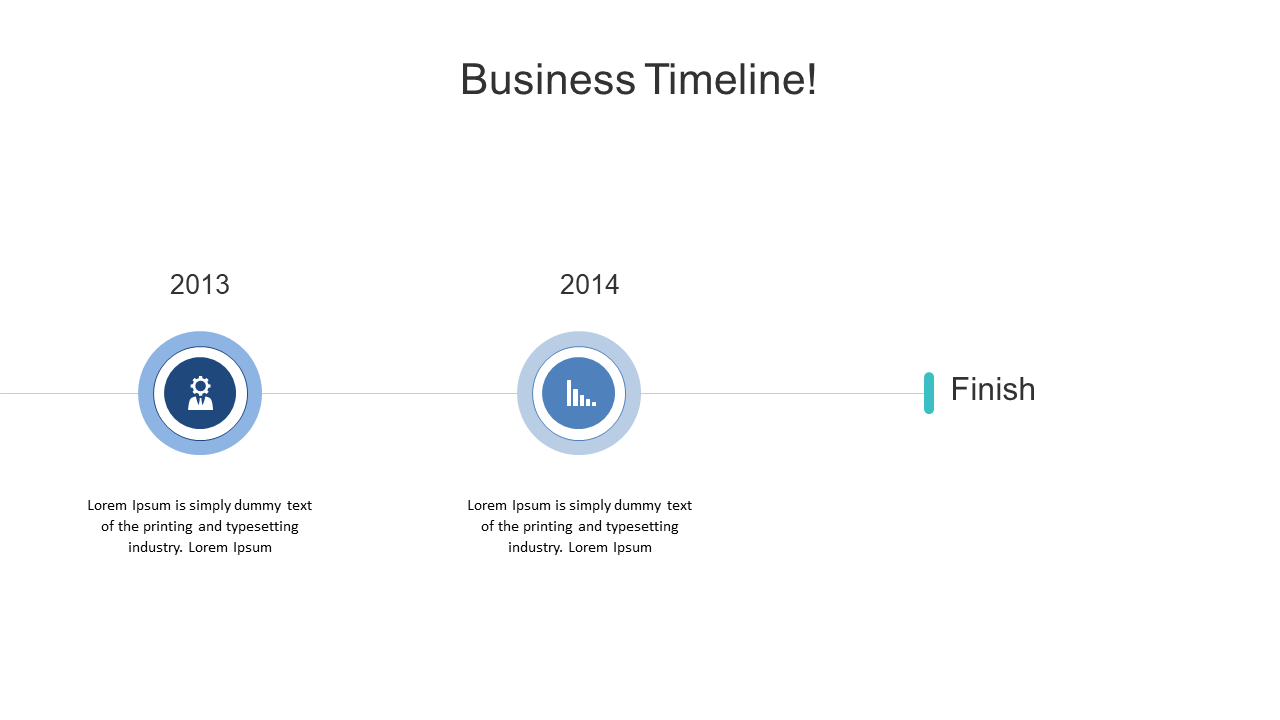
Product Description
Illustrating key milestones clearly is crucial for keeping your audience engaged and informed. Standard timelines can sometimes lack visual appeal, causing important details to get overlooked. This horizontal timeline offers a straightforward approach that makes significant events pop, ensuring nothing falls through the cracks.
Business analysts and project leads in sectors like finance or healthcare can use this slide during progress updates or strategic planning sessions. It’s also ideal for team meetings where clarity is essential for decision-making. By using this design, you can foster better understanding among all participants.
You can get this slide for just $0.99, and it’s ready for immediate download. With its easy-to-edit format in PowerPoint and Google Slides,
you can customize it quickly and keep everyone on track in no time.
$0.99 – Purchase Checkout
Added to cart