Compare Different Aspects with Four Sections
Product Description
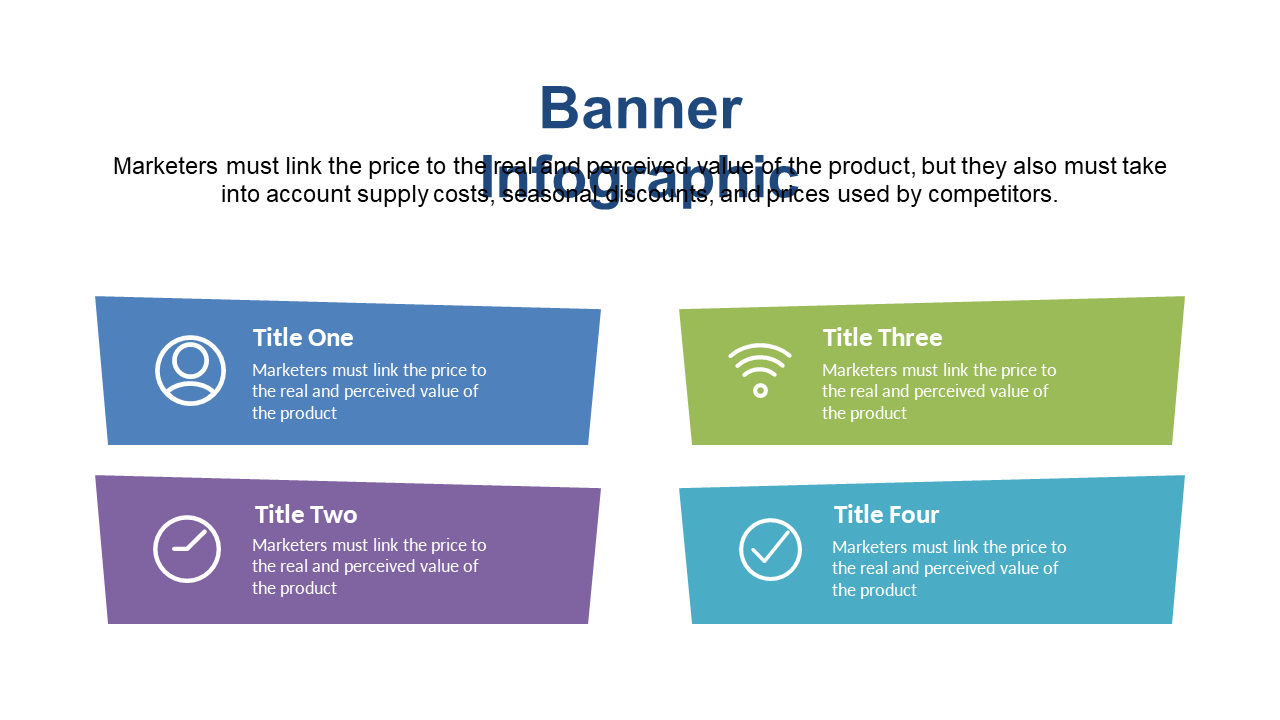
When you’re tasked with presenting complex information, it can be challenging to convey your message clearly. This slide offers a structured layout with four distinct sections, perfect for comparing various aspects of a topic side by side as you work to clarify your key points.
Consider using this slide when you’re a project manager discussing project timelines versus resource allocation, or a marketing analyst comparing campaign metrics from last quarter to this quarter.
It’s also ideal for product managers evaluating features against competitor offerings. Available for only $0.99, this slide is ready for instant download and is fully editable in both PowerPoint and Google Slides, making it simple for you to tailor it to your needs.
$0.99 – Purchase Checkout
Added to cart







