Compare Key Metrics with Four-Point Layout V2
Product Description
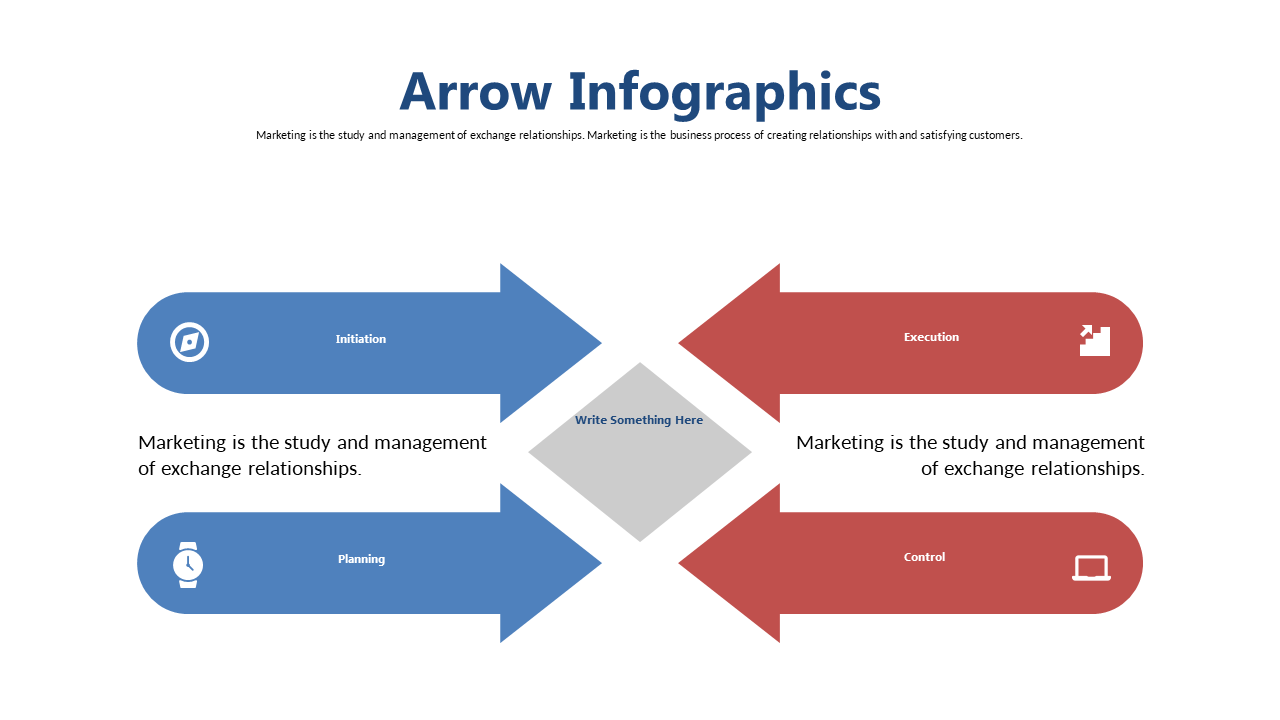
Making sense of complex data can feel overwhelming, especially when you’re pressed for time. This four-point layout simplifies your message by allowing you to present key metrics side by side, making comparisons easy and clear for your audience. It’s designed to help you cut through the noise and focus on what truly matters.
Consultants, data analysts, and project managers can benefit from this slide during client presentations, quarterly reviews, or team strategy meetings. Whether you’re dissecting sales data or evaluating project performance, this layout keeps your insights organized and accessible.
It’s the perfect tool to help you convey your findings without losing your audience’s attention. For just $0.99, you can download this slide and start editing it right away in PowerPoint or Google Slides. It’s ready for use in minutes, so you can focus on delivering your message, not stressing over design.
$0.99 – Purchase Checkout
Added to cart







