Present Product Features with Comparison Table
Product Description
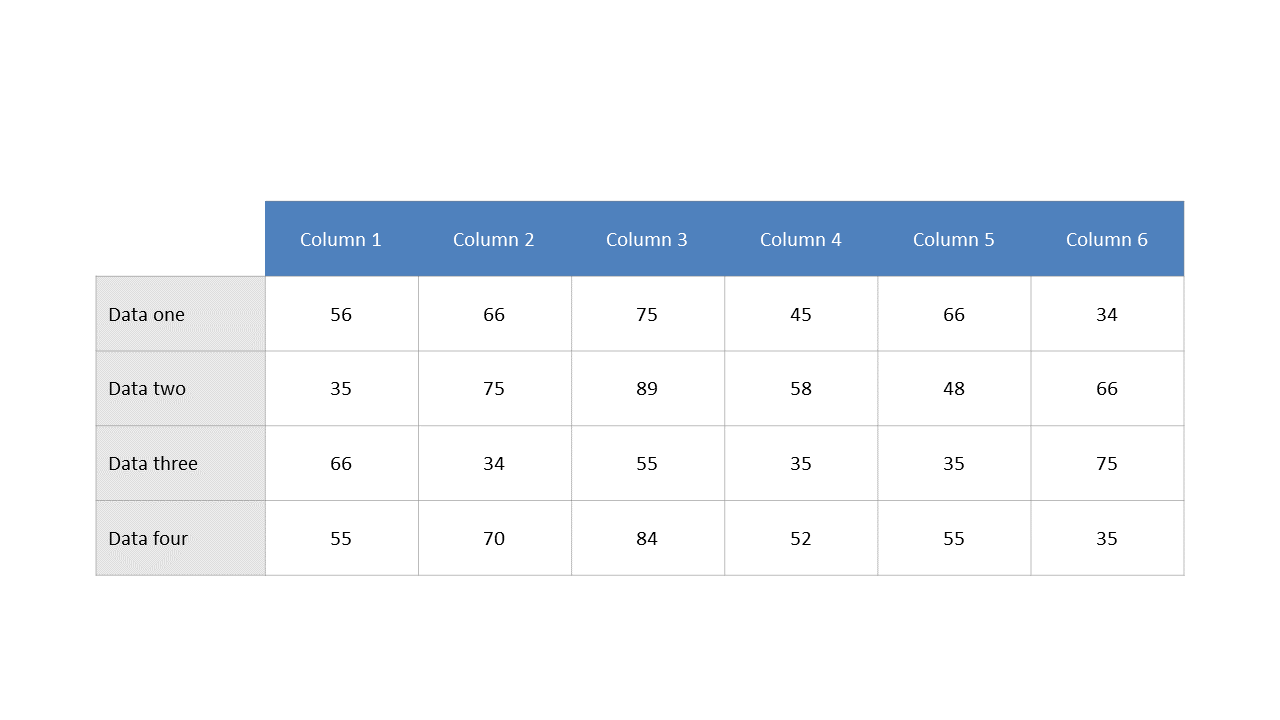
When clarity is crucial, especially under tight deadlines, it can be tough to convey the differences between product features effectively. This slide helps you sidestep confusion by providing a well-organized table layout that showcases features side by side. Your audience will appreciate the clarity, as they can easily identify critical differences at a glance.
Think of a product manager leading a demo meeting, or a marketing specialist presenting side-by-side comparisons to clients. This slide works wonders in tech sales presentations, product reviews, or even internal team meetings where decisions hinge on feature comparisons.
It’s designed to keep your audience engaged while delivering the essential information they need. For just $0.99, you can download this slide instantly. It’s fully editable, making it easy to customize in PowerPoint or Google Slides so you can make your presentation shine without any hassle.
$0.99 – Purchase Checkout
Added to cart







