Editable Maps of Belgium and Czech Republic
Product Description
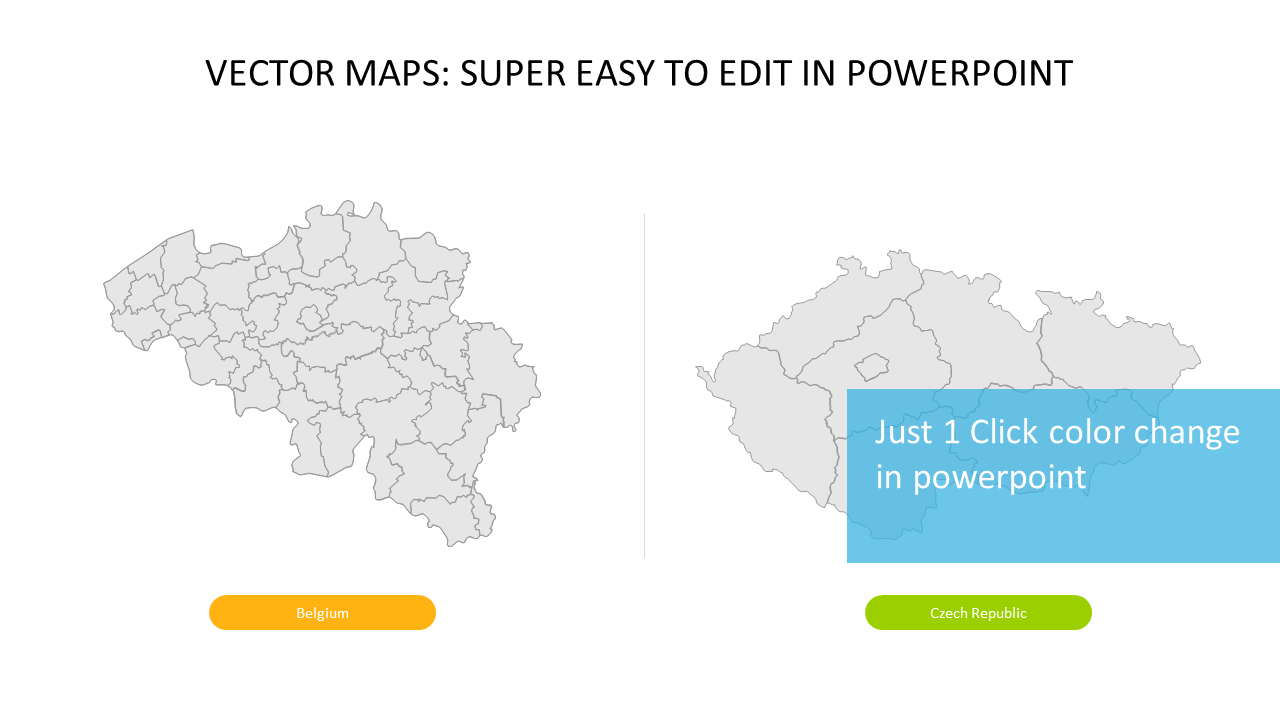
Presenting regional data without clear visuals can often lead to confusion and misunderstandings. This slide provides editable vector maps of Belgium and the Czech Republic, allowing you to customize the visuals in a way that emphasizes key data points relevant to your audience.
Marketing analysts preparing reports for European market trends or sales managers outlining territory plans will find these maps especially useful. Whether you’re in a board meeting discussing new market entry or presenting to your team about customer demographics, these maps can enhance your narrative.
At just $0.99, this slide is ready for instant download and easy to edit in PowerPoint or Google Slides. You can make adjustments in minutes, ensuring your presentation is both professional and tailored to your needs.
$0.99 – Purchase Checkout
Added to cart