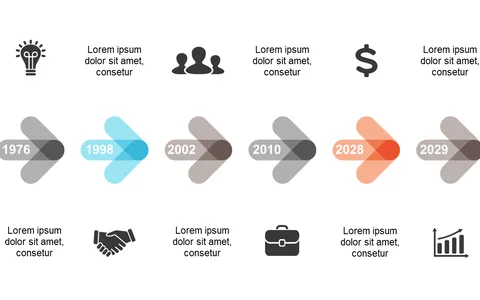
Showcase Milestones with Curved Timeline Layout

Product Description
Presenting a project’s chronology can often feel overwhelming, especially when you need to communicate key milestones clearly. This curved timeline layout transforms a complex sequence of events into a visually appealing and easily digestible format that captures your audience’s attention.
This slide is perfect for project managers outlining phases during a quarterly review, marketers detailing a campaign timeline, or educators illustrating historical events. Whether you’re in a tech firm launching a software update or an agency promoting a marketing strategy, this template will make your presentation shine.
For just $0.99, you can download this slide instantly and edit it to fit your specific needs in PowerPoint or Google Slides. Customize the circles and colors to represent your unique themes, and you’ll be ready to impress your audience in no time.
$0.99 – Purchase Checkout
Added to cart